 Click to view posters in PDF format.
Poster 1 (~4.7 mb) Poster 2 (~7.2 mb) Poster 3 (~4.5 mb) Poster 4 (~1.4 mb)
PSExploring the Jurassic Carbonate Platform Margin, Majunga Basin, Madagascar*
By
Robert E. Webster1 and Paul S. Ensign2
Search and Discovery Article #10128 (2007)
Posted June 25, 2007
*Adapted from poster presentation at AAPG Annual Convention, Long Beach, California, April 1-4, 2007
1Hunt Oil Company, Dallas, Texas, 75202 ([email protected])
2Formerly Hunt Oil Company, Dallas; currently, Nexen Petroleum USA, Dallas, Texas, 75251
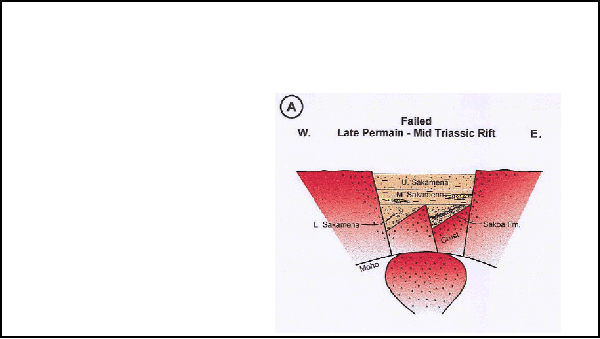
The onshore Majunga basin covers about 35,000 km² in northwest Madagascar and extends offshore. Above the Permo-Triassic Karoo rift complex, basin sedimentary fill includes a Jurassic section with Liassic organic-rich shale and a Dogger carbonate platform, overlain by Cretaceous marine sandstone and shale. Seven deep wells, including two offshore, had failed to test the Dogger limestone paleo-shelf edge. In 1998, Hunt Oil Company obtained a PSC covering the onshore basin and carried out field work, photogeology, Landsat mapping, and seismic reprocessing of 1983-1992 data.
Excellent Jurassic marine source rocks updip of the platform margin contained TOC’s of 10 to 23%. Modeling of downdip shale, of unknown source quality, showed maximum oil generation would have occurred in the Late Cretaceous. Dogger shelf-margin facies, capped by Upper Jurassic and Cretaceous shale, were in structurally high positions at that time, providing excellent trap geometry. Reprocessed seismic showed an area of anomalous high amplitude running parallel to the Jurassic shelf edge, and acoustic impedance inversion suggested high probability of significant porosity development. Post-Jurassic basinward tilting precluded structural closure, but a large porosity-pinchout trap was indicated. In 2000, the Belobaka-1 was drilled to 9520 ft (2901.7 m), encountering 183 ft (56 m) of water-bearing Dogger oolitic limestone with 12 to 22% porosity. A technical success, the well demonstrated the presence of reservoir-quality porosity at the bank margin, but the absence of hydrocarbons suggests either poor source facies downdip or an inadequate porosity seal in the carbonate rocks
.
|
|
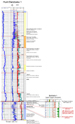
Figures 1-1 – 1-2
Majunga Exploration History (Onshore/Nearshore) • 1950-1968: S.P.M. § Aeromag and Gravity § Seismic- 1500 km, 1 to 6 fold § 2 Wells- Ihopy 1 & Tuiliere 1 • Invalid prospects • Mesozoic tests • 1968-1975 • Conoco § Seismic- 185 km, poor quality § 1 Well (Sophia 1) - Mid-Jurassic and Karoo test. • AGIP (shallow offshore) § Seismic- 6500 km; poor quality § 2 Wells: Mariarano 1 & Mahajamba 1 • Mesozoic tests • 1975: Nationalization. OMNIS created • 1983-1985: AGIP § Coastal zone seismic- 1300 km, poor quality • 1988-1992: Shell § Reprocessed 1585 km gravity § Seismic- 4906 km, fair to good quality § 2 Wells (Marovoay 1 & Ankara 1) • Unsuccessful; Karoo objectives • 1998-2002: Hunt Oil Co. § Reprocessed >1000 km seismic § 1 Well (Belobaka 1), Jurassic test.
In 1998, Hunt began an extensive seismic reprocessing effort with the goal of enhancing the possible identification of porosity in the Dogger formation. Over 1000 kilometers of Agip and Shell seismic data were reprocessed. This total includes approximately 660 kilometers in the area directly downdip from the Marovoay-1 and Tuilerie-1 wells. AVO analysis, acoustic impedance inversion, and pre-stack depth migration were also carried out on key lines. Additionally, a photogeologic and Landsat study of the basin and an extensive field geologic program were completed in 1998. Finally, the Belobaka 1 was drilled in 2000 to test an interpreted porosity pinchout trap in the Dogger limestone.
Petroleum Geology of the Contract Area
Subsequent to Triassic rifting, the Majunga Basin consisted of a passive margin from Jurassic through Cretaceous time. Potential reservoirs include the carbonates of the Jurassic Dogger formation, and sandstones of the Triassic, upper Liassic and Cretaceous. Regional seals exist in Upper Jurassic and Cretaceous shales. Excellent source rocks were identified in the Upper Liassic Beronono Shale, which has known TOC values in excess of 10% in outcrop. BASINMOD modeling shows that maximum oil generation from the Beronono Shale occurred during the Late (?) Cretaceous, at a time when the overlying porous shelf-edge facies of the Dogger were in a structurally high position. Previously, all tests of the Dogger were located significantly updip from the shelf-margin in tight platform facies. Together, these aspects made this under-explored petroleum system a highly attractive exploration target.
Seismic Mapping of Porosity
In order to identify a location for a deep test of the Dogger-age Bemaraha Limestone, it was essential to determine the most likely areas of reservoir development within this carbonate section. On seismic, the boundary between the top Dogger carbonates and overlying shales is expressed as a strong peak followed by a trough, as shown on line 90-MC-52. While this peak results from the large acoustic impedance contrast at the shale/carbonate boundary, the underlying trough exhibits more amplitude variability, which is related to changes in the uppermost Dogger rock properties. A map of the relative amplitude of the seismic trough at the top Dogger illustrates how the trough exhibits a distinct trend of high amplitudes running parallel to the Jurassic shelf edge. Note this is significantly downdip from the tight, platform facies encountered in the Tuilerie-1 and Marovoay-1 wells, where amplitude values are much lower. Seismic modeling of line ML-19-84 shows that less dense (more porous) carbonate near the top of the Dogger limestone, encased within tight, higher-density rock, causes an increase in the amplitude of the trough, which represents the top of the porous zone. A peak occurs at the base of the porous zone, reflecting an increase in impedance. This scenario is not observed on seismic in the Dogger section at either Tuilerie-1 or Marovoay-1. In an attempt to better correlate the modeling results to the actual seismic data and to investigate the significance of the high amplitude trend, acoustic impedance inversion was carried out on several dip lines running from the anomalous area to the updip wells. The inversion result for line 90-MC-52, which ties Marovoay-1, is shown. Red colors within the Dogger section indicate the lowest impedance values. Assuming this interval consists primarily of limestone and dolomite out to the shelf break, the low impedance zones should have a reasonable chance of correlating to porosity development. The most interesting impedance anomalies occur at CPD 760, at the shelf edge, and CDP1200, while none exist at Marovoay-1. Similar anomalies are evident on the inversion of line ML-19-84, at the same relative dip position as those on line 90-MC-52. By comparing the low impedance zones to the amplitude map of the trough (top porosity) near the top Dogger, a direct correlation is found to exist between the anomalous high amplitudes and the low impedance values. Based on the results of the seismic modeling and acoustic impedance inversions, the amplitude map can therefore be considered as a pseudo-porosity map of the uppermost portion of the Dogger carbonates. Thus, the areas of highest relative amplitude (red and orange) were predicted to be zones having the greatest probability of porosity development. Belobaka 1 was drilled on line ML-19-84 to test this potential porosity trap.
Drilling Results: Belobaka 1
No four-way structural closures or fault traps were identified in the basin at the Dogger or shallower horizons. However, a large stratigraphic trap was delineated corresponding to the area of high amplitude and low acoustic impedance along the paleo-shelf edge of the mid-Jurassic Dogger section, the Bemaraha Limestone. The Hunt Belobaka 1 well was drilled to test this potential porosity trap, spudding on August 16, 2000, and reaching TD of 9520 ft (2901.7 m) on September 21, 2000. The well spudded in Danian or Maastrichtian limestone. Below 218 ft (66.4 m) is 7670 ft (2338 m) of Cretaceous-age clastic rocks, both continental and marine. The upper 2000 ft (610 m) is dominated by poorly consolidated sandstone with interbedded claystone of probable deltaic to nearshore marine origin. The claystone increases downward and becomes 100% of the section between 5400 and 7115 ft (1646 to 2168.8 m), where it is a slightly overpressured plastic shale that forms an excellent seal for any underlying traps. Between 7115 ft (1646 m) and the Bemaraha Limestone at 7888 ft (2404.3 m), the rock is mostly glauconitic siltstone with minor marl and sandstone layers. The Bemaraha (Dogger) Limestone was the objective of the well. The top part of the limestone is oolitic and intraclastic grainstone, tightly cemented by sparry calcite. Between 8113 to 8442 ft (2472.8 to 2573.1 m), however, there are beds of poorly cemented oolites with a net thickness of 183 ft (56 m) of reservoir quality rock, with porosity in excess of 12% that reaches as high as 22%. Below the porous oolitic grainstones, the lower Bemaraha is again tightly cemented, composed mostly of intraclast wackestone with some low porosity dolomite beds below 9000 ft (2743 m) and some apparent pisolitic beds near the base. Below the limestone are sandstone, siltstone, and claystone believed to be the Isalo Formation. No oil shows were observed, although minor fluorescence was present continuously from 5300 ft (1615 m), and the porous oolite section showed brown staining. Total gas was quite low throughout the well, and the Bemaraha reservoir was filled with salt water. Although excellent porosity was encountered, validating the seismic model, the absence of trapped hydrocarbons suggests either poor quality source rocks occur downdip in the basin or, more likely, the lack of an effective seal updip in the carbonate platform facies. If a stratigraphic trap does exist in the platform margin oolites, it is most likely located along depositional strike toward the structurally higher basin margins.
Thanks to Hunt Oil Company for permission to present this paper. Thanks to many current and former Hunt employees and consultants who contributed to the evaluation of this basin, including George Roth, Gary Mitchell, Tony Gonnell, Gerhard Martin, and Fritz Fischer.
|


