Click to view article in PDF format.
GCP-P and P-SV Seismic Wave Modes at Salt Boundaries*
By
Bob Hardage1, Diana Sava1, Michael DeAngelo1, and Randy Remington1
Search and Discovery Article # 40237 (2007)
Posted May 8, 2007
*Adapted from the Geophysical Corner column, prepared by the authors, in AAPG Explorer, April, 2007, and entitled “Which Seismic Wave Mode is Best?”. Seismic examples were provided by WesternGeco. Editor of Geophysical Corner is Bob A. Hardage. Managing Editor of AAPG Explorer is Vern Stefanic; Larry Nation is Communications Director.
1Bureau of Economic Geology, The University of Texas at Austin ([email protected] )
General Statement
Salt-sediment boundaries are common seismic imaging targets that exist at many depths across several basins. Some of these boundaries are salt-sand interfaces; others are salt-shale interfaces. In this article we consider the reflectivity behavior of P-P and P-SV wavefields at salt-sediment interfaces in marine environments, to determine if one seismic wave mode (P-P or P-SV) has an imaging advantage over the other for studying deep salt-related traps.
uGeneral statementuFigure captionsuTwo ModelsuExamplesuConclusion
uGeneral statementuFigure captionsuTwo ModelsuExamplesuConclusion
uGeneral statementuFigure captionsuTwo ModelsuExamplesuConclusion
|
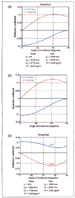
Two ModelsThis analysis was done using a simple two-layer Earth model: 1) In the first model, the bottom layer was salt (with properties VP = 4550 m/s, VS= 2630 m/s, and r = 2.16 gm/cm3), and the top layer was sandstone (with properties f = 10 percent, VP = 4679 m/s, VS = 2840 m/s, and r = 2.476 gm/cm3). 2) In the second model, the lower layer was this same salt, but the upper layer was first defined to be a “soft” shale (with properties f = 20 percent, VP = 3400 m/s, VS = 1754 m/s, and r = 2.316 gm/cm3) and then was changed to a “hard” shale (with properties f =5 percent, VP = 4700 m/s, VS= 2775 m/s, and r = 2.536 gm/cm3).
In our terminology, a “hard” shale has velocities greater than salt, whereas a “soft” shale has velocities less than salt. Our modeled reflectivity behaviors are displayed as Figure 1. The P-P and P-SV reflectivities for a salt-sandstone interface (Figure 1a) are almost identical to the reflectivities for the interface between salt and soft shale (Figure 1b). Two important principles are defined by these reflectivity functions: 1) P-P reflectivity is large and P-SV reflectivity is small for small angles of incidence. 2) The opposite is true for large angles of incidence where P-SV reflectivity is large and P-P reflectivity is small.
For many source-receiver offsets, this reflectivity physics means that in situations where the dip of a salt-sediment interface is small, the P-P mode should be a better choice than the P-SV mode for imaging that interface. In contrast, if a salt-sediment interface has a large dip angle, the P-SV mode should image the interface better than does the P-P mode.
ExamplesExamples of these reflectivity behaviors are demonstrated by the events near the base of sequence D identified on Figures 2 and 3. The base of sequence D in Figure 2 involves high-dip salt-sediment interfaces. These interfaces are bolder events in P-SV image space than they are in P-P image space, just as the reflectivity functions in Figures 1a and 1b predict.In Figure 3, the salt-sediment interfaces near the base of sequence D are lower-dip boundaries. These interfaces are bolder reflections in P-P image space than they are in P-SV image space; this is what the reflectivity physics in Figures 1a and 1b states.When evaluating these interface dips, it is helpful to use the distance scale marked below each seismic profile to judge the approach angle of raypaths arriving at the interface from source-to-receiver offsets of 10 kilometers, the maximum offset used to acquire these particular 4C OBC data. The reflectivity of an interface between salt and hard shale (Figure 1c) is different from the reflectivities of salt-sand and soft shale-salt in that P-P reflectivity is robust at all incidence angles. For an interface between salt and hard shale, the P-P mode will produce robust reflections not only at low-dip salt boundaries, but also at high-dip boundaries.
These reflectivity principles imply that optimal mapping of salt-sediment interfaces can result when both P-P and P-SV data are used for imaging and these two images are then combined into a unified geologic interpretation. |