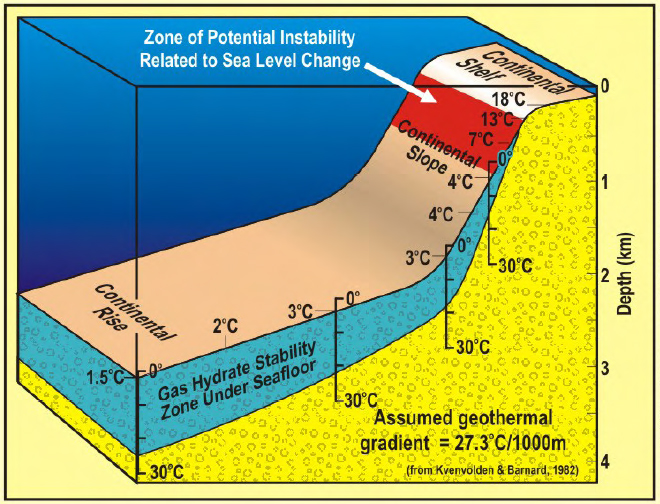
Figure 2-3. Diagram illustrating theoretical thickness of the gas hydrate stability zone in continental margins as determined by water depth (hydrostatic pressure), water temperature, the geothermal gradient, and gas composition.
Figure 2-3. Diagram illustrating theoretical thickness of the gas hydrate stability zone in continental margins as determined by water depth (hydrostatic pressure), water temperature, the geothermal gradient, and gas composition.