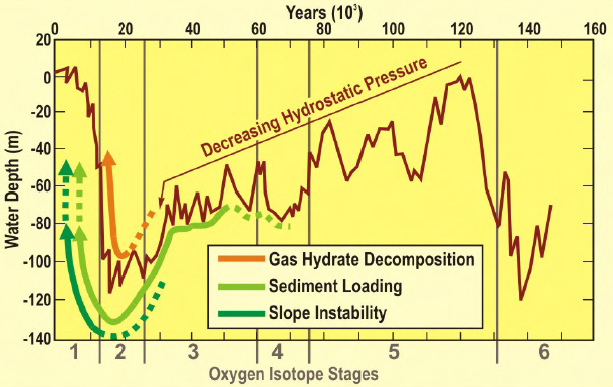
Figure 2-2. Water depth vs. oxygen isotope stage (with shallower depths corresponds to sea level highstands), along with curves for gas hydrate decomposition, sediment loading, and surface instability.
Figure 2-2. Water depth vs. oxygen isotope stage (with shallower depths corresponds to sea level highstands), along with curves for gas hydrate decomposition, sediment loading, and surface instability.