Click to view article in PDF format.
Development of the Barnett Shale Play, Fort Worth Basin*
By
Kent A. Bowker1
Search and Discovery Article #10126 (2007)
Posted April 18, 2007
*Adapted from extended abstract published by West Texas Geological Society (www.wtgs.org), from whom permission to post the article was kindly granted.; following is the citation: Bowker, K.A., 2003, Recent developments of the Barnett Shale play, Fort Worth Basin: West Texas Geological Society Bulletin, v. 42, no. 6, p. 4-11. For the most recent published articles on the Barnett Shale, the viewer is referred to:
-
AAPG Bulletin, 2007, v. 91, no. 4.
-
Steward, Dan B., 2007, The Barnett Shale Play: Phoenix of the Fort Worth Basin: A History: Fort Worth and North Texas Geological Societies (http://www.fwgs.org/fwgsbooks.htm).
1Star of Texas Energy Services, Inc., The Woodlands, Texas ([email protected])
In terms of monthly production, the Newark East (Barnett Shale) field has become the largest gas field in Texas. Nearly all of the gas and condensate production from the Barnett Shale is in Newark East field. Production grew from 80 MMCF/D in January 2000 to over 560 MMCF/D in 2003 because of accelerated new-well drilling and old-well reworks/refracs (Figure 1). In 2003 the field also produced approximately 2400 bbls of condensate a day; an additional 25,000 bbls a day of gas liquids were processed out of Barnett gas production. The Barnett Shale play is one of several successful shale plays currently in the United States (Figure 2), and after 2000 it quickly became one of the most productive (Figure 3).
The field was discovered (more accurately, the first completion attempt was made) in 1981. There were only 566 Barnett wells in January 2000 (operated by 12 companies) but well over 2000 wells in 2003 (and 44 operators; interestingly, there are no majors currently active in this multi-TCF play). Over 400 new Barnett wells were drilled in 2003 alone. There were over 2.5 TCF of booked proven gas reserves in the field in 2003. The history of the evolving geologic and engineering concepts that guided development of the Barnett is a tribute to rare perseverance in the oil patch, and the success of the Barnett play may provide a model for prospecting for other large shale-reservoirs.
|
|
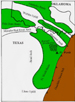
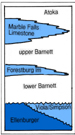
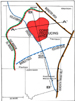
Newark East field is located in the northern portion of the Fort Worth Basin, just north of the city of Fort Worth (Figure 4). The basin was formed during the Paleozoic (mainly Mississippian and Pennsylvanian), and its presence is related to the formation of the Muenster arch to the northeast and the Ouachita system to the southeast. The pre-Mississippian Bend arch (a northern extension of the Llano uplift) bounds the basin to the west, and the Red River uplift is to the north. The Barnett is entirely Mississippian and was deposited in a back-arc setting behind the nascent Ouachita system. There are no Silurian or Devonian strata preserved in the basin, if in fact they were ever deposited. At Newark East, the Barnett Shale is divided into three informal members (Figure 5). The lower Barnett averages 300 ft thick in Newark East field. The lower Barnett lies directly above a regional angular unconformity. In the core area (Figure 6) it rests on the Ordovician Viola Limestone or slightly older Simpson Group. West of the primary producing area (toward the Bend arch) the lower Barnett rests on the Ordovician Ellenburger Group (Figure 7). The nature of this extensive angular unconformity is the subject of current research efforts by the major participants in the play because it controls the western boundary of currently-recognized commercial gas production in the field. The Forestburg limestone separates the lower and upper Barnett shale members. The Forestburg thins rapidly south across the Barnett productive area; it is well over 200 ft thick in the northern productive area of central Wise and Denton counties and is only a few feet thick at the southern boundaries of these two counties (Figure 8). The upper Barnett averages 150 ft thick across the field. The Mississippian Marble Falls Limestone lies above the Barnett Shale. As is discussed below, the stratigraphy within, above, and below the Barnett has a direct bearing on the potential of a Barnett prospect in the basin. The primary producing facies of the Barnett (the black shale portion of the formation) is volumetrically composed of approximately 45% quartz (probably mostly altered radiolarian tests), 27% clay (mainly illite, with a trace of smectite), 8% calcite and dolomite, 7% feldspar, 5% organic matter, 5% pyrite, 3% siderite, and a trace of native copper and phosphatic minerals. In a 1- to 10-ft thick zone at the very base of the lower Barnett, the concentration of phosphatic minerals (predominantly apatite) and pyrite can each reach well over 10% (an ultimate maximum-flooding surface). Toward the northern portion of the basin, the organic-rich facies of the Barnett grades into a higher carbonate concentration. The carbonate material appears to be detrital and deposited in a series of flow deposits. The source of the detrital carbonate was probably the rising Muenster arch (Figure 8) and possibly the Red River uplift. It is unclear if the detrital carbonate is erosional debris (e.g., weathered Ellenburger) or syndepositional Mississippian carbonate that was washed into the deeper portion of the basin. The Barnett has an average porosity (in the productive portions of the formation) of 6% and matrix permeability measured in nanodarcies. The average pore throat has a radius of less than 0.005 micrometer (about 50 times the radius of a methane molecule; Figure 9). When it was deposited, the organic-rich facies of the Barnett was composed of approximately 20% total organic carbon (TOC). In the thermally-mature portions of the basin (i.e., in the gas window, where the Barnett is prospective and producing) the Barnett now averages 5% TOC. The kerogen is Type II. Dan Jarvie has calculated that the total amount of organic matter that was converted to hydrocarbons in the Barnett makes it one of the most prolific hydrocarbon-generating systems in the world. Only a small fraction of the hydrocarbons generated in the Barnett are stored in the Barnett or in other reservoirs in the basin; the vast majority of the hydrocarbons generated by the Barnett escaped to the surface. The top of the Barnett is 6600 ft deep in the western portion of the field and 8000 ft in the northeastern portion. The unique (and very advantageous) thermal history of the Barnett is one of the important reasons for the economic success of the play. The thermal history of the Fort Worth basin is directly related to the emplacement of the Ouachita system. Certainly, depth of burial is important in regard to the thermal maturity of the stratigraphic column within the basin; but the proximity of the Ouachita belt, and its influence on the heat flow in the basin during the late Paleozoic, is paramount. Sections of the Barnett bordering the Ouachita front (regardless of depth) have the highest thermal maturity and, hence, the lowest BTU-content of produced gas. The region of the Barnett away from the Ouachitas and areas shielded from the Ouachita front (i.e., the area adjacent to the Muenster arch [which happens to be the deepest part of the basin]) are thermally less mature. The Gas Technology Institute (GTI), formerly the Gas Research Institute (GRI), reported the vitrinite-reflection values in the gas-charged portion of the basin range from 1.0 to 1.3%. The actual values for the gas area range from 1.3%Ro in the western portion of the play to 2.1%Ro toward the east. The Barnett in areas ±40 miles from the Ouachita front is in the oil window; as the Ouachita system is approached from the edge of the oil window, the BTU content of the gas gradually decreases. There is an excellent correlation between %Ro and BTU content of produced gas in individual wells. I believe the Ouachita front acted like a giant squeegee, pushing hot brine out into the basin. The heat flow in the basin has since greatly diminished. Modeling (1-D) indicates that there was a large variation in heat flows across portions of the basin. No fluid-inclusion or other advanced thermal-maturity studies have been published on the basin.
Every shale reservoir is unique. The Barnett does not behave like the Antrim, which does not behave like the Devonian Appalachian shales, etc. The geologist or engineer exploring for, or exploiting, a shale reservoir needs to study other producing shale reservoirs; but just blindly transferring technology, techniques, etc. from one shale play to another will result in failure (at least initially). Yet, one has to start somewhere, and that is how the initial development of the Barnett began in 1981. The primary driver for Mitchell Energy (the acknowledged leader in all Barnett activities, and recently acquired by Devon Energy) was to reverse the company’s decline in North Texas gas production. Mitchell had a substantial investment in large gas-gathering infrastructure and a large gas-processing plant in the area; a new source of gas was needed to continue to feed this infrastructure. It was widely known that while drilling any deeper well (at the time, most production in the basin was from the shallower Atokan Bend section; Figures 7 and 8) substantial gas shows in the Barnett section would be encountered, often including ethane through pentane. For years, of course, the shows were written off as “shale gas.” Then in the early 1980’s a few pioneers at Mitchell suggested a test of the Barnett. The first well the firm drilled to test the Barnett was an economic failure (the C.W. Slay #1 in southeast Wise County; now one of the better wells in the field thanks to the success of re-fracs, which are discussed below), as were the subsequent 40 wells. All of the early Barnett tests were actually deepenings of shallower Pennsylvanian wells. These early tests helped to define the structural complexity of the play, along with help in perfecting the optimum completion technique. It was easily recognized that Barnett wells would need to be stimulated; so energized (foam) fracs were tried first because these type of stimulations were used in the Appalachians. Because the Barnett is a shale, it was felt that expensive clay stabilizers and other chemical additives were needed in the frac fluid. In 1984 the first non-foamed gel frac was attempted. The size of the gel fracs were increased during the next couple of years until a designed theoretical half-length of 1500 ft was reached (about 1,000,000 lbs of sand and 13,000 bbls of gelled fluid). Over the period from 1985 through 1997 every well in the Barnett was stimulated with what came to be known as a “massive hydraulic frac” (the 1500 ft gel-frac design). These stimulations were very expensive, costing more then the actual drilling and casing of the well. During this time, Mitchell experimented with a horizontal well, performed several detailed core studies (some supported and published by GRI (now GTI), including adsorption-isotherm analyses), and studied the dynamics of the fracture stimulations on the Barnett. However, none of this work drastically altered the exploitation strategy employed for the Barnett. The extensive core analyses indicated that, on average, the Barnett contained about 40 BCF/mile2, with only 20% of that total being sorbed. With an average recovery of 1 BCF per well, drilling on a 55-acre spacing resulted in a recovery factor of 30%, which should be considered excellent considering the nature of the reservoir rock. With the assumed 30% recovery, there was no incentive to consider downspacing below 55 acres, re-fracs, or initiating an extensive testing program of the upper Barnett.
In the late 1990’s two events occurred that resulted in the rapid acceleration in the exploitation of the Barnett:
Water fracs (sometimes referred to as light-sand fracs) were a radical concept during this time because the general consensus among completion engineers was that as much proppant (sand) as economically possible had to be placed in the Barnett in order to maximize fluid conductivity to the wellbore. Gel can carry plenty of proppant, un-gelled water can carry very little. However, as was later demonstrated, the natural permeability of the rock is so low that any increase in conductivity (even that created by just cracking the rock without any proppant) was enough to make a very successful well. The water fracs also cost 70% less than the massive-hydraulic fracs, a fact that helped push finding and development costs to below $1.00/MCF for Mitchell. It was this reduced cost that helped convince Mitchell management to attempt the first water frac in an area of the field that had poorer gas production. The first three water fracs were only marginally successful, but Mitchell was encouraged enough to continue to perfect the technique. The typical water frac in the Barnett now consists of 1 million gallons of water and 50,000 lbs of sand. No clay stabilizers are added to the water because it has been demonstrated that the Barnett does not react detrimentally to water (the permeability of the Barnett is already so low that it would be difficult to measure any effects of clay swelling, anyway). It is now apparent that wells that are water fraced produce as much or more gas than the massive hydraulic fracs. It is also apparent (because of increased interference with neighboring wells) that the water fracs cause a much different fracture pattern than the gel fracs did. In 1997, Chevron drilled a Barnett test, the Mildred Atlas #1, two counties south of the primary producing fairway in Wise and Denton counties (Figure 6; the well and surrounding acreage are now owned by Enre Corporation, whose permission to publish certain data from the well is very much appreciated). During the drilling of the Atlas #1 (located in southeast Johnson County) a 60-ft conventional core was taken in the middle of the Barnett. On-site canister desorption on three samples of the core was performed, and the results showed that the sorbed-gas content was much higher than that reported in the literature for the Barnett in Wise County. Later adsorption-isotherm analysis confirmed the canister desorption results. The Atlas #1 well proved to be an economic failure for Chevron (for reasons unrelated to the Barnett itself) following stimulation with a massive hydraulic frac. However, the gas-content results from this well convinced Mitchell to reevaluate the gas content of the Barnett in Newark East field. Mitchell began the reevaluation effort in early 1998 by taking whole cores (including pressure-retained cores) in several wells throughout the field in both the upper and lower Barnett. Canister desorption was performed on scores of samples (later adsorption analyses were run and confirmed that the Barnett is fully gas saturated at Newark East field and probably throughout the area where the Barnett is in the gas window). The difference between the earlier adsorption-isotherm tests performed by GRI (now GTI) contractors (on the T.P. Sims #2) and the ones Chevron and Mitchell ran later is striking (Figure 10). The problem with the GRI-sponsored tests may be that the equipment used in these tests could not reach higher pressure or that the investigators used a faulty experimental procedure. Much of the core that Mitchell took during this period was preserved on-site in dry ice (that is, the core that was not placed in desorption canisters). From this preserved core, porosities and water saturations were determined using advanced techniques developed by Core Laboratories. The results showed that the productive, more organic-rich portions of the Barnett average 6% porosity and 25% water saturation. Devon has reported publicly that the average gas content in the Barnett is approximately 150 BCF/mile2 (about 575 MCF/acre-ft for the entire Barnett section). This value is over three times the previous gas in-place estimate published by GRI. In 1999, the combination of decreased completion costs and the realization that the gas content was actually over three times what was previously assumed encouraged Mitchell’s engineers and geologists to attempt completions in the upper Barnett and attempt re-fracs of existing wells. It was quickly apparent that the upper Barnett was contributing substantially to the production stream (adding an average 250 MMCF of reserves per well). It was also apparent that re-stimulated wells were very successful, adding, on average, 500 MMCF of additional reserves per well (Figures 1 and 11). Mitchell (Devon) and Schlumberger have published frac-mapping results that indicate that the re-fracs are successful because these subsequent stimulations propagate into rock not affected by the first frac (Figure 12). It appears that operators in the play will be able to economically re-stimulate wells several times.
Exploration and Exploitation Strategies There is no consensus among knowledgeable Barnett workers as to why the formation is such a prolific reservoir. Most workers believe that the existence of an extensive natural-fracture system is the key to the Barnett’s productivity. While I believe that natural fractures (probably mostly microfractures) are an important factor in the Barnett, they are not the key factor in the play. The huge amount of gas in place, in an overpressured and fully-saturated (in terms of sorption) state, is what makes the Barnett so prolific. Before the reservoir is drilled and fracture-stimulated, the Barnett is at a state of pressure equilibrium. The pore pressure (about 0.52 psi/ft in the gas-saturated portion of the play) is perfectly balanced by the capillary pressure of the rock; the Barnett is its own seal (besides being its own reservoir and hydrocarbon source). When the rock is fracture-stimulated, this equilibrium is disturbed, and gas diffuses from the matrix into the hydraulic fractures, where it flows to the borehole. Natural fractures probably also contribute to the permeability (and to a small portion of the gas storage capability) of the reservoir, but the contribution of natural fractures to permeability appears to be minor when compared to the induced fractures. It is tempting for the geologist or engineer to believe that locating natural fractures is the key to exploiting the Barnett, or any other shale reservoir. This is certainly the case with the Antrim Shale; but in the Barnett play extensive macroscopic natural fracturing (e.g., near fault zones) hinders gas production because the fractures that are present are filled with carbonate cement. This cement also appears to have at least partially occluded the matrix porosity around the fault zones. Wells drilled on or near structural highs also perform poorly. The best place to drill a Barnett well is where there are no structural flexures or faulting of any kind. However, there are areas of the field that are clearly more productive than others, and no explanation for these anomalies has been clearly proven. Gas saturation seems constant across the region, so it is tempting to invoke increased natural fracturing in these areas as the explanation. Mercury-porosimetery results (Figure 9) show that, at the current depth and any other conceivable past depth of burial, the Barnett has (and had) an irreducible water saturation of nearly 100%. However, detailed core analysis shows that the Barnett averages only 25% water saturation in the organic-rich portions of the formation; the water saturation increases rapidly with an increase in carbonate concentration in the rock. The expulsion of copious hydrocarbons from the Barnett is what “dried” the reservoir. No wetability experiments have been performed on the Barnett to my knowledge. However, I suspect that the Barnett is at least slightly oilophilic (oil-wet) because of the relatively high organic content in the rock and the unusually high percentage of frac-water recovery seen in the field (approaching 60-70% in some areas of the field). The properties of the Barnett itself do not define the current boundaries of economic production; the Barnett is fully gas-saturated over a much broader area than is currently productive. The only true hard boundaries to the ultimate Barnett prospective area are the Muenster arch, the Red River uplift, and the Ouachita thrust belt (Figure 4). The Barnett thins considerably over the Bend arch, but it is present there. In areas where the Barnett never reached the gas-generative window, the Barnett has not been economically productive to date; this is also true for most wells drilled where the Barnett rests directly on the Ellenberger, or on porous and water-saturated Viola Limestone. The next hurdle to overcome in order to expand the play is discovering a technique to stimulate the shale in areas where the Barnett is not bound above and below by effective frac barriers. In areas where the Barnett is not bound by strong, dense Viola/Simpson section below and Marble Falls Limestone above, the hydraulic frac quickly migrates out of the Barnett. If the fracture moves out of the Barnett, two things can happen:
There are three situations in the basin where there is at least one missing frac barrier: 1) areas where the Barnett rests directly on the Ellenberger, i.e., west of the Viola/Simpson subcrop (Figures 6 and 7); 2) areas where the Barnett rests on porous and water-saturated Viola Limestone, 3) areas where the Barnett is resting on the Ellenberger and, in addition, there is no Marble Falls present to act as an upper frac boundary (Figure 8).
Presently, I know of no economic Barnett wells located in these three areas. Southwest Wise and northeastern Parker counties are areas of Barnett potential where the shale is underlain by Ellenberger. Denberry, Four-Sevens, Devon, and other operators are actively drilling and experimenting with various completion techniques (including four horizontal wells) in this area in an attempt to overcome the problem of fracing out of zone and into the Ellenberger. To the south in southern Tarrant, southeast Parker, and western Johnson counties, there are no upper or lower frac barriers. The Barnett is very prospective in this area (good thickness and the shale is gas-saturated), but the lack of both an upper and lower frac containment will be a challenge to operators working this area. Reducing the cost of horizontal wells or developing alternative completion techniques that do not involve hydraulic fracturing may be the answer to making these areas with no containment barriers economic. The problems of a thin Barnett section (less than 200 ft) and being in the oil window will be more difficult to solve. Several wells have been drilled in the oil window, and oil has been recovered in several wells but at very low daily rates. The rock appears too tight to flow oil at anywhere near economic rates.
Several geologic factors contribute to the excellent productivity of the Barnett Shale. A geologist should consider the following when exploring for gas deposits akin to Newark East field:
Hill, D.G.,
and C.R. Nelson, 2000, Gas productive fractured shales
|