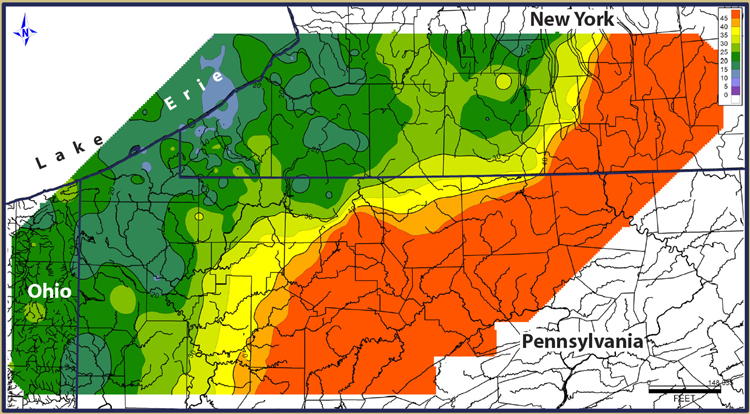
Figure 2-6. Isopach map (thickness in feet) of the basal organic-rich black shale facies of the Oatka Creek Shale showing (1) relatively constant thickness westward from the axis of minimum thickness and (2) rapid thickening of the organic-rich facies to the east, in the direction of deepening of the basin.