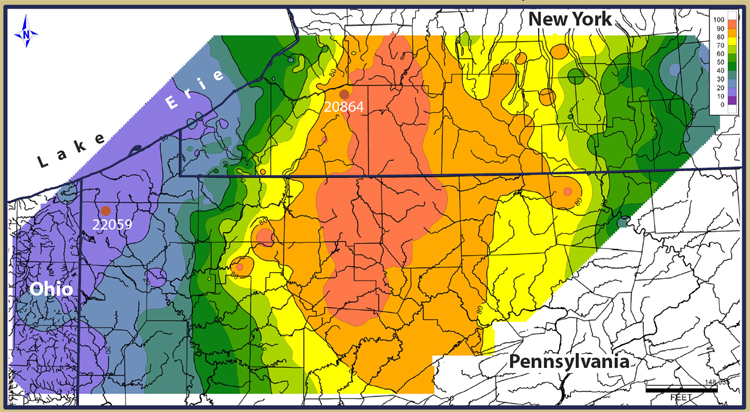
Figure 2-5. Facies map showing the percentage of black shale facies of the Oatka Creek Shale (contours in 10% increments). Note the locations of the well logs used to display the westward increase in thickness of the Oatka Creek (Figure 2-3).
Figure 2-5. Facies map showing the percentage of black shale facies of the Oatka Creek Shale (contours in 10% increments). Note the locations of the well logs used to display the westward increase in thickness of the Oatka Creek (Figure 2-3).