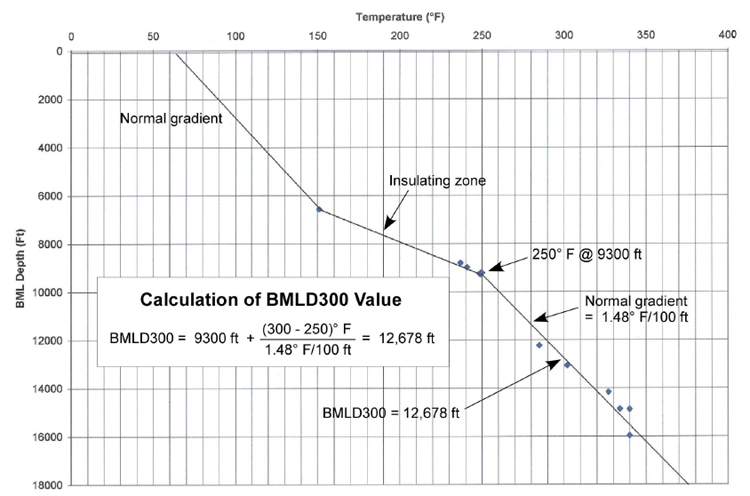
Figure 6. Average temperature-depth plot of sands in the Brazos 133A (BA133A) Field. Data from MMS Atlas of Northern Gulf of Mexico Gas and Oil Sands (2001).
Figure 6. Average temperature-depth plot of sands in the Brazos 133A (BA133A) Field. Data from MMS Atlas of Northern Gulf of Mexico Gas and Oil Sands (2001).