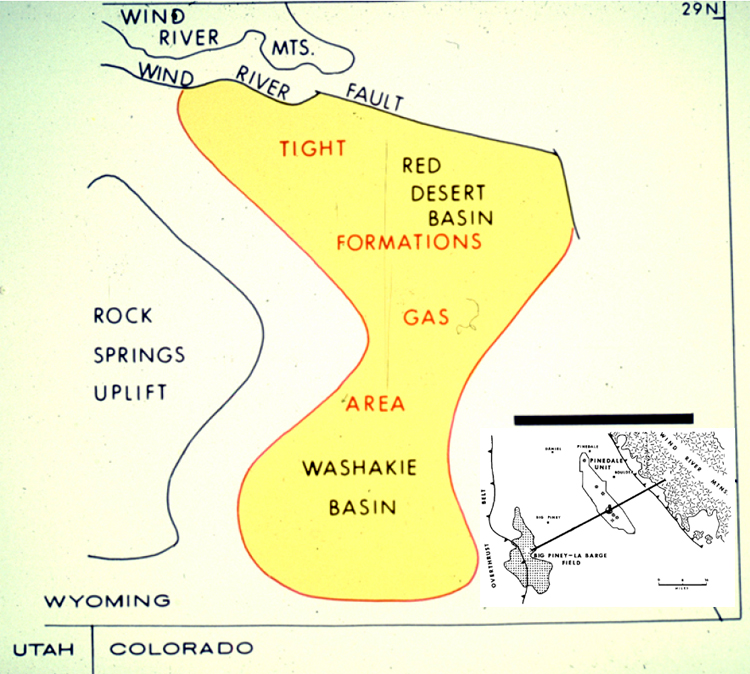
Figure 9. Map of Red Desert and Washakie basins, showing general area of “tight formations gas.” Inset (after Shaughnessy and Butcher, 1974) shows generalized line of cross-section (in Figure 10), northwest of the area of the larger map.
Figure 9. Map of Red Desert and Washakie basins, showing general area of “tight formations gas.” Inset (after Shaughnessy and Butcher, 1974) shows generalized line of cross-section (in Figure 10), northwest of the area of the larger map.