Click to view article in PDF format.
Three-Dimensional Seismic Imaging and Reservoir Modeling of an Upper Paleozoic “Reefal” Buildup, Reinecke Field, West Texas, United States*
By
Arthur H. Saller1, Skip Walden1, Steve Robertson2, Robert Nims2, Joe Schwab2, Hiroshi Hagiwara3, and Shigeharu Mizohata4
Search and Discovery Article 20044 (2006)
Posted December 20, 2006
*Adapted from article published in AAPG Memoir 81, Seismic Imaging of Carbonate Reservoirs and Systems, edited by Gregor P. Eberli, Jose Luis Masaferro, and J. F. Rick Sarg. This publication may be purchased from AAPG Bookstore.
1Unocal Corporation, Sugar Land, Texas, U.S.A. Currently, Chevron, Houston, Texas ([email protected])
2Pure Resources, Midland, Texas, U.S.A.
3Japan Oil Development Company, Abu Dhabi, United Arab Emirates; formerly, Japan National Oil Company, Chiba, Japan.
4Japan National Oil Company, Chiba, Japan
Abstract
Reinecke field is an upper Pennsylvanian to lowest Permian carbonate buildup in the southern part of the Horseshoe Atoll, west Texas, United States. The field and surrounding areas have been imaged with three 3-D seismic surveys and penetrated by many wells. Although Reinecke is commonly referred to as a reefal reservoir, deposition occurred in stratified sequences, 50-100 ft (15-30 m) thick, dominated by wackestones, packstones, and grainstones. Boundstones (mainly rich in phylloid algae) constitute only 16% of the buildup. Seismic reflectors within the buildup parallel sequence boundaries and are truncated at the margins of the buildup. Three-dimensional seismic surveys show that the top of the Reinecke buildup is highly irregular with more than 470 ft (143 m) of relief. Deep-marine shales overlie the reservoir and act as a seal for this stratigraphic trap. Reinecke's irregular, mounded morphology is the result of localized carbonate growth and erosional truncation. Much of the erosional truncation probably occurred in a deep-marine environment.
Reinecke's south dome acts a single continuous reservoir dominated by limestone (70%) with 25% dolomite. Limestone porosity is generally 5-18% (average of 11.2%) and permeability is 1-1000 md (average of 166 md). Dolomite porosity is lower (average of 8.3%), but permeability is higher (average of 894 md). Discontinuous low-permeability layers parallel to stratification serve as low-permeability baffles; however, patchy replacive dolomites cut through stratification and act as high-permeability vertical conduits. Good reservoir continuity, low-permeability baffles, and artificially enhanced bottom-water drive helped to recover more than 50% of the original oil in place. Excellent vertical reservoir continuity has allowed implementation of a crestal CO2 flood at Reinecke field. CO2 is being injected into the top of the structure, displacing residual and bypassed mobile oil downward for recovery in lower parts of the reservoir.
|
uAbstractuIntroductionuFigures 1-3uTextuSeismic datauFigures 4-7uTextuFacies/stratigraphyuFigures 8-9uTextuDepositional historyuFigure 10uTextuPorosity, permuFigure 11-12uTextuProduction historyuFigures 13-15uTextuConclusionsuReferencesuAcknowledgments
uAbstractuIntroductionuFigures 1-3uTextuSeismic datauFigures 4-7uTextuFacies/stratigraphyuFigures 8-9uTextuDepositional historyuFigure 10uTextuPorosity, permuFigure 11-12uTextuProduction historyuFigures 13-15uTextuConclusionsuReferencesuAcknowledgments
uAbstractuIntroductionuFigures 1-3uTextuSeismic datauFigures 4-7uTextuFacies/stratigraphyuFigures 8-9uTextuDepositional historyuFigure 10uTextuPorosity, permuFigure 11-12uTextuProduction historyuFigures 13-15uTextuConclusionsuReferencesuAcknowledgments
uAbstractuIntroductionuFigures 1-3uTextuSeismic datauFigures 4-7uTextuFacies/stratigraphyuFigures 8-9uTextuDepositional historyuFigure 10uTextuPorosity, permuFigure 11-12uTextuProduction historyuFigures 13-15uTextuConclusionsuReferencesuAcknowledgments
uAbstractuIntroductionuFigures 1-3uTextuSeismic datauFigures 4-7uTextuFacies/stratigraphyuFigures 8-9uTextuDepositional historyuFigure 10uTextuPorosity, permuFigure 11-12uTextuProduction historyuFigures 13-15uTextuConclusionsuReferencesuAcknowledgments
uAbstractuIntroductionuFigures 1-3uTextuSeismic datauFigures 4-7uTextuFacies/stratigraphyuFigures 8-9uTextuDepositional historyuFigure 10uTextuPorosity, permuFigure 11-12uTextuProduction historyuFigures 13-15uTextuConclusionsuReferencesuAcknowledgments
uAbstractuIntroductionuFigures 1-3uTextuSeismic datauFigures 4-7uTextuFacies/stratigraphyuFigures 8-9uTextuDepositional historyuFigure 10uTextuPorosity, permuFigure 11-12uTextuProduction historyuFigures 13-15uTextuConclusionsuReferencesuAcknowledgments
uAbstractuIntroductionuFigures 1-3uTextuSeismic datauFigures 4-7uTextuFacies/stratigraphyuFigures 8-9uTextuDepositional historyuFigure 10uTextuPorosity, permuFigure 11-12uTextuProduction historyuFigures 13-15uTextuConclusionsuReferencesuAcknowledgments
uAbstractuIntroductionuFigures 1-3uTextuSeismic datauFigures 4-7uTextuFacies/stratigraphyuFigures 8-9uTextuDepositional historyuFigure 10uTextuPorosity, permuFigure 11-12uTextuProduction historyuFigures 13-15uTextuConclusionsuReferencesuAcknowledgments
|
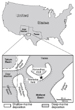
Reinecke field is a stratigraphic trap for oil in a “reefal” buildup. Reinecke field is part of the Horseshoe Atoll, a northward-opening arc of upper Pennsylvanian carbonate buildups in the Midland Basin of west Texas, United States (Figures 1and 2). Horseshoe Atoll fields are a series of stratigraphic traps that have produced more than 2 billion bbl of oil and are characterized by high permeability and high recovery efficiencies (near 50% of original oil in place [OOIP] after waterflooding) (Galloway et al., 1983). Fields on the eastern side of the Horseshoe Atoll have stratified porosity with permeability barriers to vertical flow. Reinecke and other fields on the south and west sides of the Horseshoe Atoll have vertical permeability pathways that allow the top of the reservoir to be in pressure communication with the underlying aquifer (i.e., they produce like reefal reservoirs) (Crawford et al., 1984; Saller et al., 1999). Approximately 83 million bbl of oil have been produced from Reinecke field (approximately 3 mi2 [8 km2]; Figure 3) since its discovery in 1950. The south dome of Reinecke field (approximately 1 mi2 [2.6 km2]), the focus of this chapter, has produced 46 million bbl of oil. The carbonate reservoir at the south dome of Reinecke field has approximately 470 ft (143 m) of depositional and erosional relief above its original oil-water contact at -4600 ft (-1400 m) subsea. The area has no significant tectonic deformation. The shallow-marine carbonate thins laterally and is overlain by a deep-marine shale that acts as a vertical and lateral seal. Deep-marine shales of Pennsylvanian and Early Permian age are generally assumed to be the source for the Reinecke oil. This joint Unocal-Japan National Oil Company reservoir characterization project helped to better understand the south dome at Reinecke field to implement a crestal CO2 flood. Major parts of the project included (1) deepening and coring of many wells that initially only penetrated the uppermost part of the reservoir, (2) acquisition and interpretation of multiple three-dimensional (3-D) seismic surveys, (3) construction of a geocellular reservoir model, (4) fluid-flow simulation and history match of the reservoir from time of discovery (1950) to the present, and (5) use that model to predict CO2 flood response. Before the start of this project, only a few wells penetrated the entire reservoir section in the south dome of Reinecke field. In the early phases of this project, most wells were deepened to near the original oil-water contact. The database for this study includes 12 cored wells and 60 wells with wire-line logs. Reservoir characterization included several important steps. Key stratigraphic surfaces were identified in core and then extrapolated across the rest of the field using wire-line logs. Reservoir porosity and permeability were initially measured on core material. Porosity measured in core was used to calibrate wire-line logs. Wire-line porosity logs (mainly neutron and density logs) were then used to estimate porosity in uncored wells. Permeability in uncored wells was calculated using core-derived transforms for porosity vs. permeability. Stratigraphic tops from wells were merged with seismic surfaces in EarthVision to create stratigraphic surfaces used in the geocellular model. Porosity and permeability were extrapolated between wells by ordinary kriging and then gridded in EarthVision. A model with 35 layers was built. A RESCUE export format was used as an interface between the EarthVision geocellular model and the Eclipse flow simulator. In this chapter, we will focus on (1) describing the three-dimensional reservoir characteristics of a “reefal” buildup, i.e., the south dome of Reinecke field, (2) showing how a 3-D seismic survey better imaged this “reefal” buildup, and (3) summarizing the 3-D production history of this buildup. Three-Dimensional Seismic Data
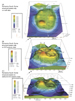
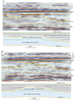
Three 3-D seismic surveys have been acquired at Reinecke. The first survey was shot in 1993 to locate possible undrilled pinnacles within Reinecke field and undrilled structures away from the main field. That initial, more regional survey (Figure 3) covered approximately 28 mi2 (72 km2) and helped in the discovery of one small nearby field. A second survey was shot in 1997 to image the south dome (approximately 5 mi2 [13 km2]) for reservoir characterization and act as a base line for a third survey shot in 1999 to attempt to image the crestal CO2 flood. The top of the Reinecke carbonate is shown regionally by the 1993 3-D seismic survey (Figure 3). Middle and upper Pennsylvanian carbonates grew on a relatively flat surface (Figure 4), and hence regional patterns of carbonate growth and erosion are shown by the structural relief on the top of the carbonate (Figure 3). The 1997 seismic survey imaged the complex top of the south dome better than the previous survey. Figure 5A shows how the south dome would be mapped by well control alone. Figure 5B shows how the top of the Reinecke reservoir would be mapped by seismic data alone. The most accurate structural map of the top of the carbonate buildup is the result of combined well and seismic data (Figure 5C). Seismic reflectors within the Reinecke carbonate are generally parallel and truncated at the margin of the Reinecke structure (Figures 6 and 7). Sequence boundaries within the reservoir interval were identified in core, but could not be identified by the seismic data alone (Figure 6). Reflectors overlying the reservoir are basinal strata that downlap against the carbonate buildup with an apparent progradation toward the west (Figures 2, 7). Two main factors have made lateral variations in reservoir characteristics (porosity, permeability, and lithology) difficult to image with the Reinecke seismic data. (1) The top of carbonate is a very irregular surface having a very large impedance contrast with the overlying shale (Figure 6). This resulted in a very high amplitude seismic response at the top of the Reinecke reservoir and an uneven penetration of seismic waves into the reservoir carbonate. Most of the reservoir is less than a seismic wavelet below the top of carbonate, resulting in most of the reservoir being in the seismic zone dominated by the shale-limestone contact. (2) Variations in limestone and dolomite give seismic impedance responses that are similar to variations in porosity within a pure limestone or pure dolomite. Because limestone-dolomite variations and porosity variations are scattered throughout the reservoir, it is very difficult to separate the two. Depositional Facies and Stratigraphy
The main reservoir at Reinecke field is an upper Pennsylvanian to lowest Permian carbonate, which is overlain and sealed by siliciclastic and carbonate mud of Early Permian age. The reservoir at Reinecke field is mainly limestone (70%) with substantial dolomite (25%) and minor amounts of mixed limestone-dolomite (20-80% dolomite; 5% of reservoir). Shale is present in trace amounts (<1%). Most of the Reinecke reservoir occurs in three main sequences (between sequence boundaries 100 and 400) that are stratified and typically 15-30 m thick (Figures 8 and 9). Those three sequences are Virgilian (late Pennsylvanian) in age (G. Wilde, personal communication, 1997), and hence part of the Cisco Formation. Cores show fractures, root traces, caliches, and brecciation immediately below sequence boundaries 100, 200, 300, and 400. Small amounts of oil also occur in Wolfcampian (Lower Permian) pinnacles (above the 100 marker) and in the Canyon Formation (Missourian; below the 400 marker, but above the oil-water contact). Deposition of these sequences occurred during “ice-house” times, and hence were subjected to high-amplitude sea level fluctuations (Veevers and Powell, 1987). Sequences typically have a thin basal part, a thick middle part, and upper part with variable thickness (Figures 8 and 9). Basal parts generally contain thin shale and/or bioclastic packstone-grainstone. The middle of sequences is dominated by fossiliferous wackestone (commonly phylloid algal wackestone) and phylloid algal boundstone. Grainstone is common in the upper part of sequences (Figures 8 and 9). Crinoidal grainstone occurs in the upper part of the two uppermost Pennsylvanian sequences. Oolitic grainstone is also common in the upper part of the two lower sequences (Figure 9). Nine main carbonate depositional facies are present, and boundstone comprises only 16% of this “reefal” buildup (Table 1). Carbonates above horizon 100 are highly variable in thickness and have a sharp upper contact with the overlying shale. Wells near the edge of the south dome have none of this Wolfcamp interval present (Figure 9). Thin accumulations of fossiliferous packstone and grainstone occur immediately above horizon 100, and fossiliferous wackestone dominates the rest of the interval. Crinoids and phylloid algae are common. Many fractures and vugs filled with coarse, fibrous to prismatic cement are also present above horizon 100. In the #277 well, the uppermost Wolfcamp carbonate is a dark lime mudstone that is overlain by a thin spiculitic chert and then dark shale that acts as the seal for the Reinecke reservoir (Figure 8). Interpretation of Depositional History
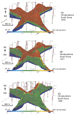
Although the south dome of Reinecke field has a mounded or “reefal” morphology, it is composed of fairly stratiform sequences that apparently formed in response to variations in relative and probably eustatic sea level. Sequence boundaries are identified by soil- and exposure-related features (fractures, root traces, caliches, and brecciation) observed in core. Abrupt decreases in bulk-rock stable carbon and oxygen-isotope ratios below those surfaces support subaerial exposure (Figure 8). A depositional model for typical sequences is shown in Figure 10. The uppermost carbonate (lower Wolfcampian; above “100” marker) in the Reinecke buildup contains a no petrographic, cathodoluminescent, or stable isotopic evidence of freshwater diagenesis or subaerial exposure (J.A.D. Dickson, personal communication, 1999), suggesting that the last stage of erosion was not associated with subaerial exposure. Relief on the Reinecke carbonate structure is probably the result of differential carbonate growth, subaerial karstification, and deep-marine erosion following deposition and drowning of the Reinecke buildup. As the 3-D seismic data show (Figures 3, 6, 7), the upper surface of the Reinecke carbonate buildup is very irregular. Several sequences (Wolfcampian and parts of two Pennsylvanian) are truncated by that surface (Figures 3, 6, 7), suggesting that the top of carbonate is, at least in part, erosional. Strata overlying Reinecke and other Horseshoe Atoll fields are deep-water shales and carbonate sediment gravity flows (Vest, 1970; Galloway et al., 1983). The apparent seismic onlap of basinal strata (Figures 6 and 7) is really downlap or baselap of the distal toes of Wolfcamp sequences whose shelf margin is 50-100 km to the east (Figures 1 and 2). The Reinecke area remained in a deep-marine environment from drowning in the earliest Wolfcampian (earliest Permian) through much of the Leonardian (middle Permian) (Figure 2). During that time, lowstand clastic and carbonate slope strata prograded from the east and north and largely filled the Midland Basin. Final filling of the basin occurred during deposition of the San Andres Formation (upper Leonardian and lower Guadalupian; Figure 2). Shallow-marine carbonate and evaporite deposition dominated the Reinecke area during the rest of the Guadalupian and Ochoan (middle and Late Permian; above San Andres Formation). Distribution of Porosity, Dolomite, and PermeabilityMost porosity at Reinecke occurs in sequences subjected to subaerial exposure and meteoric diagenesis. Meteoric diagenesis associated with subaerial exposure apparently helped preserve intergranular porosity and microporosity in micrite by creating a lithified framework that resisted compaction during subsequent burial. Porosity is widespread in carbonates below sequence boundary 100 (Figure 8). Most carbonates above sequence boundary 100 are not porous. Calcite cements are volumetrically minor throughout the Reinecke buildup. Many pores (molds, vugs, fractures) in the Reinecke reservoir were created by leaching of biotic constituents and dolomitization (Crawford et al., 1984). Excluding lime mudstones, depositional facies that are still limestone have similar average porosities (9.3-12.9%; Table 1). Permeability is highly variable depending on pore types within facies. Phylloid algal boundstone generally has the highest permeability. Lime wackestone and packstone with intercrystalline microporosity have lower average permeabilities (Table 1). Bioclastic grainstone with significant intergranular porosity has moderate permeability. Dolomite is a later diagenetic phase that replaced parts of many different depositional facies during moderately deep burial (J.A.D. Dickson, personal communication, 1989). Dolomite has generally lower porosity (average of 8.3%) and higher permeability (average horizontal and vertical permeabilities of 894 and 334 md, respectively) than limestones (average porosity of 11.2%; average horizontal and vertical permeabilities of 165 and 11 md, respectively) (Table 2; Figure 10). Dolomites with substantial vuggy and coarse intercrystalline porosity have very high permeability (>500 md). Shale is present in small amounts (<1%); however, it is locally important as a barrier to vertical fluid flow. Although porosity and permeability are variable, reservoir-grade porosity (>4%) and permeability (>1 md) are fairly continuous laterally and vertically. No field-wide barriers to vertical or horizontal flow have been recognized in the main part of the reservoir; however, dense carbonate mudstone and shale have formed local permeability barriers or baffles. Lack of field-wide permeability barriers is, in part, because of a lack of laterally extensive tidal flat wackestone-packstones or evaporites that effectively stratify fluid flow in many shelfal carbonates. High-permeability dolomites cut across sequences and greatly enhance vertical fluid flow. Therefore, reservoir fluids flow vertically and laterally through the Reinecke reservoir. As Figure 11 and Tables 1 and 2 show, permeability is related to reservoir rock type (limestone vs. dolomite). The 3-D distribution of porosity (Figure 12A) and dolomite (Figure 12B) were extrapolated from well data following 3-D seismic horizons. Permeability at each location (Figure 12C) was calculated using porosity and porosity vs. permeability transforms for each lithology.
Production History
Reinecke field was discovered in 1950 at depths of approximately 6700 ft (-4300 ft, 1310 m subsea). The oil was 42o API with a gas-oil ratio of 1266 ft3/bbl. Coning of bottom water was recognized as a problem early in the development of the field. Consequently, most wells were completed open hole after penetrating only a few feet of porosity in the upper part of the reservoir. Original 40-ac spaced wells in Reinecke field flowed for almost 20 yr under a natural water and solution gas drive. Primary production rates at Reinecke were limited by the Texas Railroad Commission. Reinecke field produced at its top allowable rate until 1968 (Figure 13). Between 1950 and 1970, reservoir pressure fell from 3162 to 1984 psia, just below the reservoir's bubble point of 2000 psia. Water injection into the underlying aquifer began in the late 1960s as part of a pressure-maintenance program. The field was unitized in 1972, and a fieldwide pressure-maintenance program was started. Production rates and reservoir pressure climbed as water was injected below the oil-water contact (Figure 13). In the early 1970s, the Texas Railroad Commission raised allowable production rates, and production rose to approximately 11,000 bbl/day. In 1977, pumps were put on producing wells and water production increased significantly. Since 1980, water production has been increasing as oil production decreased. Drilling of 20-ac infill wells in the middle to late 1980s provided a brief increase in oil production (Figure 13). Primary, secondary, and infill production have produced more than 83 million bbl or 46% of the OOIP. In the south dome, approximately 52% of the OOIP has been produced. This reservoir shows a classic “reefal” reservoir response to a weak bottom-water drive that was artificially enhanced. Figure 14A shows simulated hydrocarbon saturation as of 1970 with a relatively horizontal oil-water contact that had been moving up in response to production from the top of the reservoir. Between 1970 and 1977 (Figure 14B), the artificially enhanced bottom-water drive pushed much of the mobile oil to the well perforations at the top of the reservoir. By 1996 (Figure 14C), mobile water was to the top of reservoir resulting in oil being less than 2% of the fluid produced (i.e., >98% water cut). As the model in Figure 14C shows, much residual oil (oil that will not naturally flow and is trapped in pores) remains in the Reinecke reservoir. A gravity-stable crestal CO2 flood is being implemented at Reinecke field to recover substantial amounts of that residual oil as well as additional unswept mobile oil. CO2 is being injected into the top of the reservoir in five wells in the south dome (Figure 15). The overlying basinal shales should prevent CO2 from leaking up and out of the reservoir. CO2 should preferentially fill the highest parts of the reservoir and displace water and oil downward. A relatively horizontal oil bank is predicted to form and move downward through the reservoir as CO2 fills the uppermost pores in the reservoir. Water injection must continue below the oil-water contact to maintain aquifer pressure. The remaining producing wells were deepened to near the original oil-water contact. Those wells will recover oil as an oil bank moves down through the reservoir below the CO2 cap (Figure 15). This plan is feasible because of the excellent vertical and lateral continuity of porosity and permeability in the Reinecke reservoir. High-permeability streaks and lack of stratigraphic confinement of permeability within the reservoir would make a pattern flood very inefficient. ConclusionsThe reservoir at Reinecke field is a carbonate buildup that was deposited during the late Pennsylvanian and earliest Permian. Three-dimensional seismic surveys show its morphology in detail that would be impossible with well control alone. The final geometry of Reinecke's reservoir was the product of localized carbonate growth, karstification, and deep-marine erosion after the buildup was drowned. Deep marine erosion was apparently responsible for much of the very irregular top of the Reinecke carbonate. Although reefal in its morphology, the Reinecke reservoir is composed of stratiform sequences with only minor boundstone. Porosity and permeability are continuous through the Reinecke reservoir, and hence the south dome acts as a single container. Reinecke production is typical of “reefal” -type reservoirs with water from an underlying aquifer pushing oil up into perforations at the top of the reservoir. This mechanism was so efficient that 50% of the OOIP was produced by primary recovery and injection of water below the oil-water contact. A crestal CO2 flood is currently underway and is feasible because of Reinecke's excellent reservoir continuity. The main value of the 3-D seismic surveys was to image the gross reservoir geometry in detail, which was essential for accurate volumetrics, successful reservoir simulation, and design of the crestal CO2 flood. References CitedCrawford, G.A., G.E. Moore, and W. Simpson, 1984, Depositional and diagenetic controls on reservoir development in a Pennsylvanian algal complex: Reinecke field, Horseshoe Atoll, west Texas: West Texas Geological Society Transactions, Southwest Section AAPG, West Texas Geological Society Publication 84-78, p. 81-90. Galloway, W.E., T.E. Ewing, C. M. Garrett, N. Tyler, and D. G. Bebout, 1983, Atlas of major Texas oil reservoirs: Texas Bureau of Economic Geology, 139p. Saller, A.H., A.W. Walden, S. Robertson, M. Steckel, J. Schwab, H. Hagiwara, and S. Mizohata, 1999, Reservoir characterization of a reefal carbonate for a crestal CO2 flood, Reinecke field, west Texas, in T.F. Hentz, ed., Advanced reservoir characterization for the 21st century: Gulf Coast Section, SEPM Foundation, Nineteenth Annual Research Conference, p. 259-268. Veevers, J.J., and C.McA. Powell, 1987, Late Paleozoic glacial episodes in Gondwanaland reflected in transgressive-regressive depositional systems in Euramerica: Geological Society of America Bulletin, v. 98, p. 475-487. Vest, E.L., 1970, Oil fields of Pennsylvanian-Permian, Horseshoe Atoll, west Texas, in M.T. Halbouty, ed., Geology of giant petroleum fields: AAPG Memoir 14, p.185-203. AcknowledgmentsThis chapter describes part of the results of a joint Unocal-Japan National Oil Company reservoir characterization project. Many people from both companies helped in this work, including Merle Steckel, Brian Ball, Stan Frost, John Gogas, Phil Johnston, and Tim Anderson. Constructive reviews by Steve Bachtel, Charlie Kerans, and Jose Luis Masaferro greatly improved this manuscript. We thank Japan National Oil Company and Unocal for the permission to publish this chapter. |