Click on image to view enlargement.
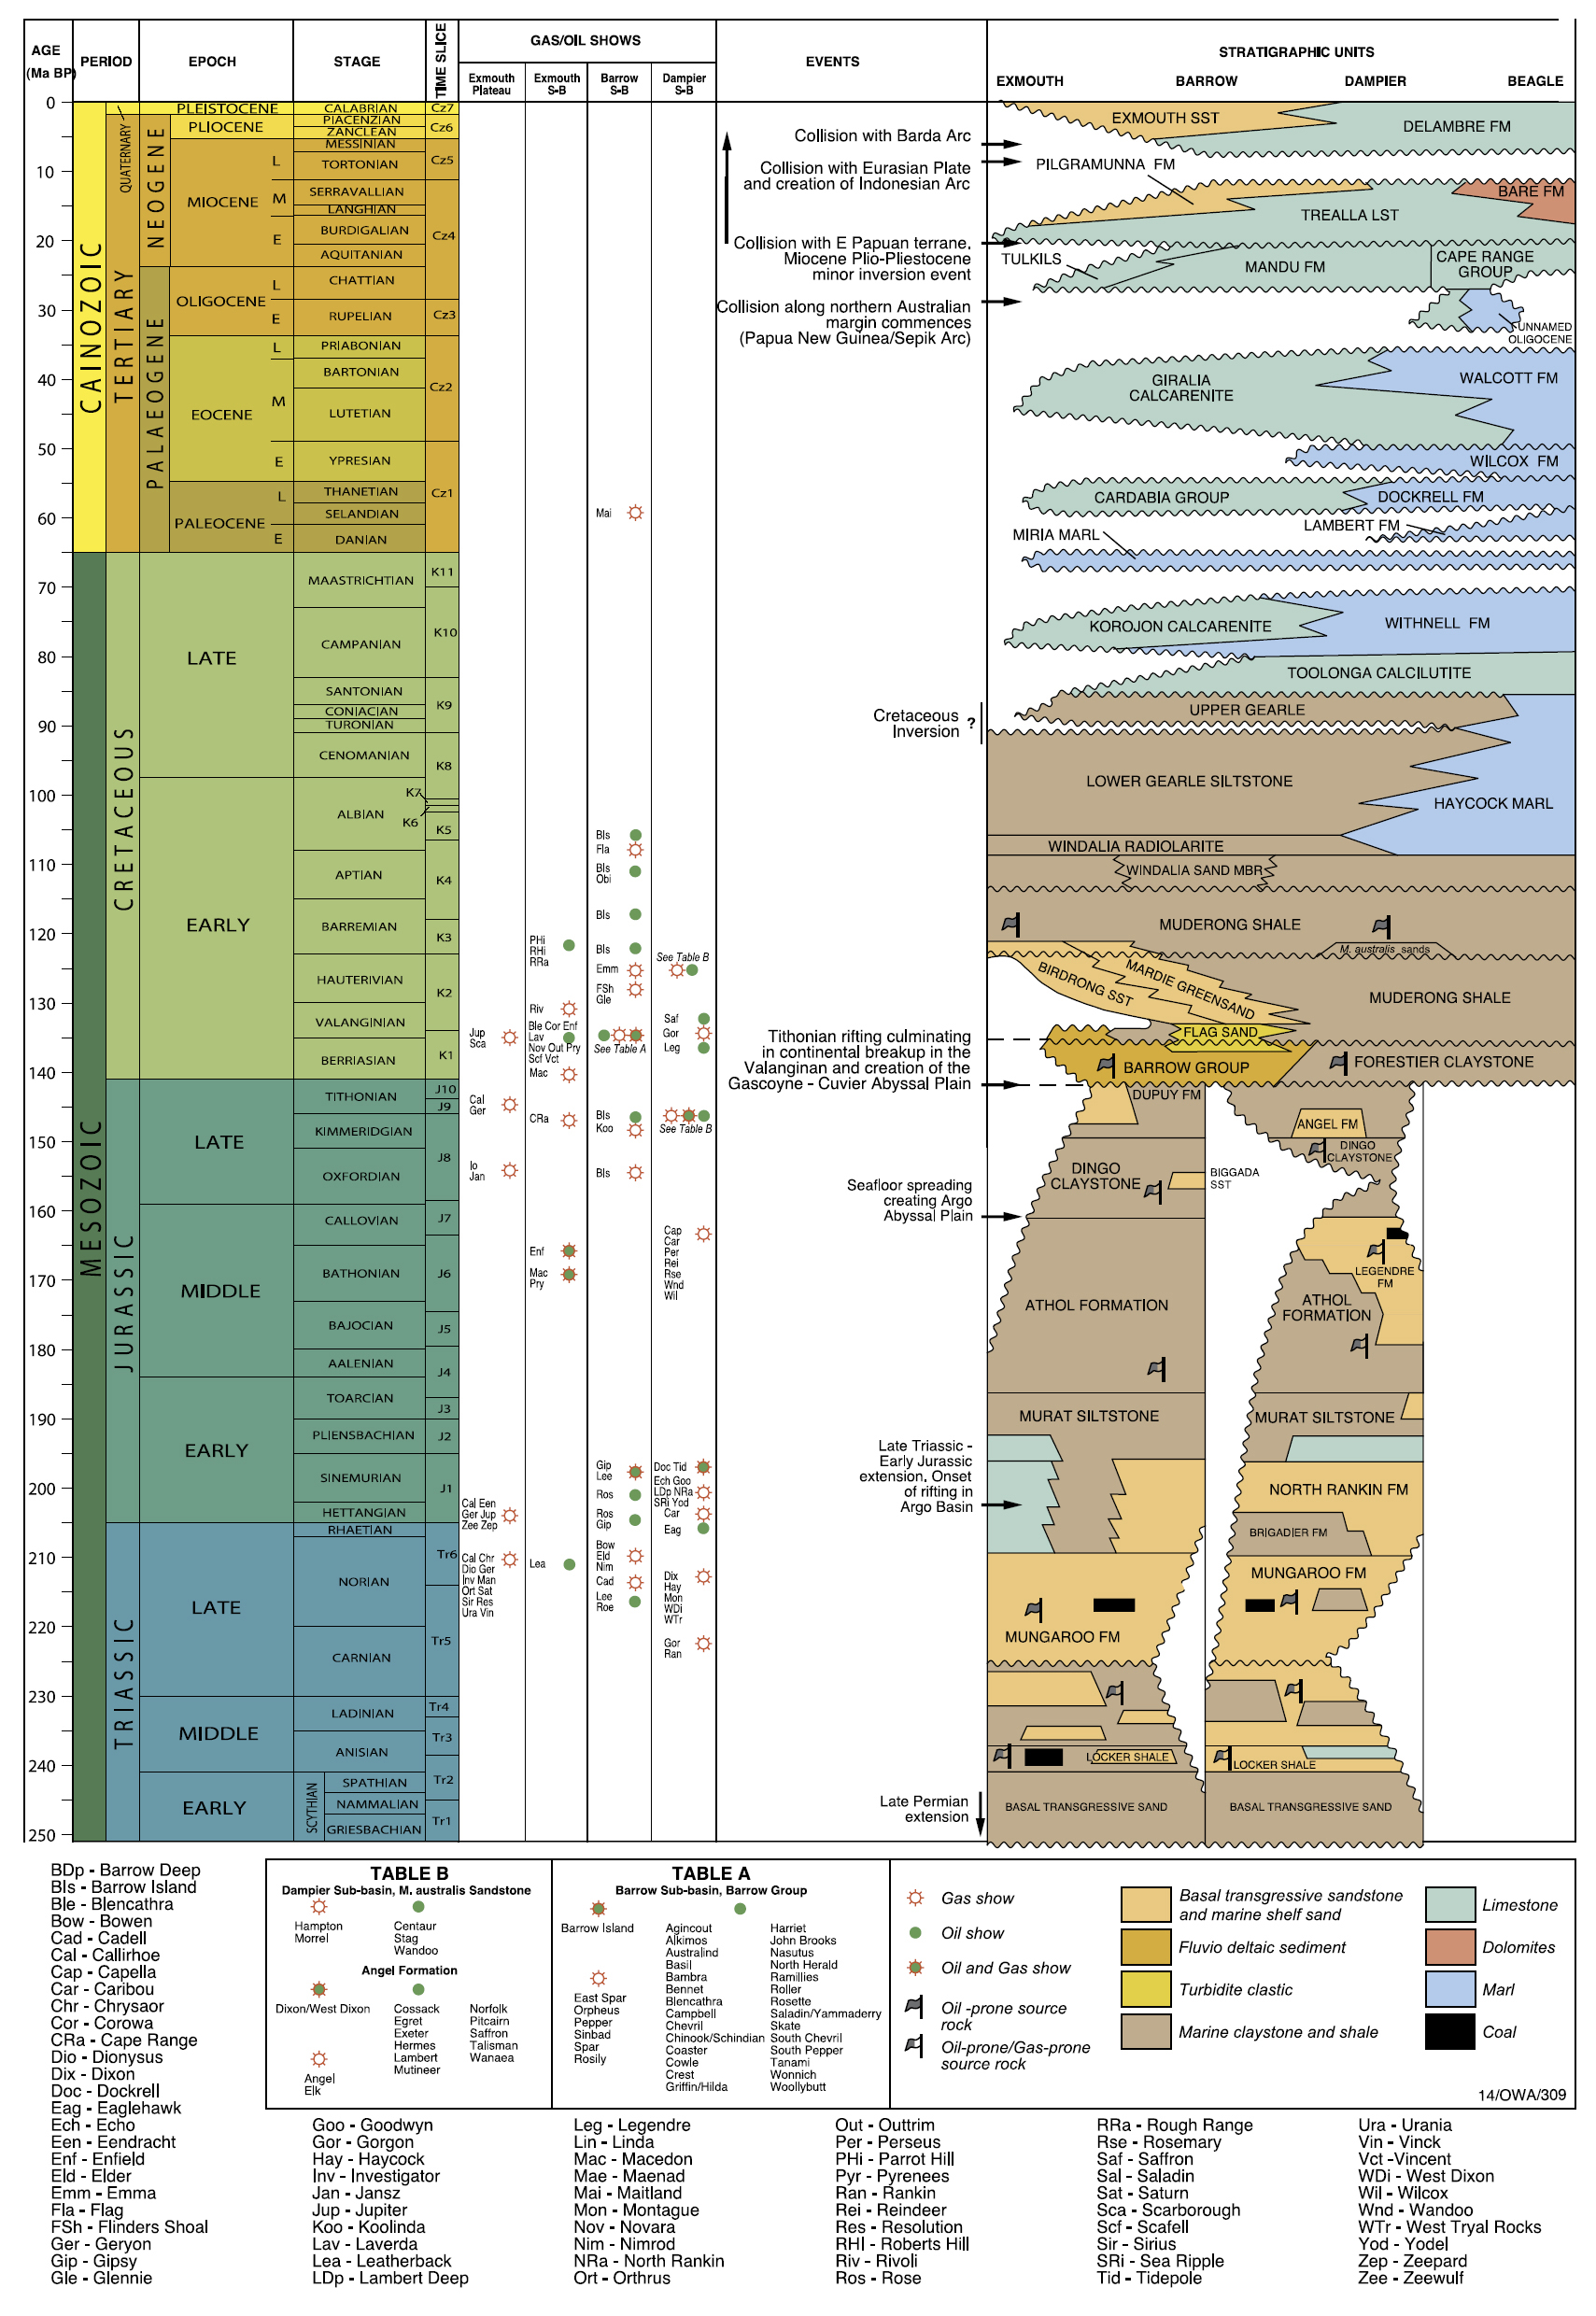
Figure 2. Stratigraphic correlation chart, with hydrocarbon occurrences and tectonic events, North West Australia.
Click on image to view enlargement.
Figure 2. Stratigraphic correlation chart, with hydrocarbon occurrences and tectonic events, North West Australia.