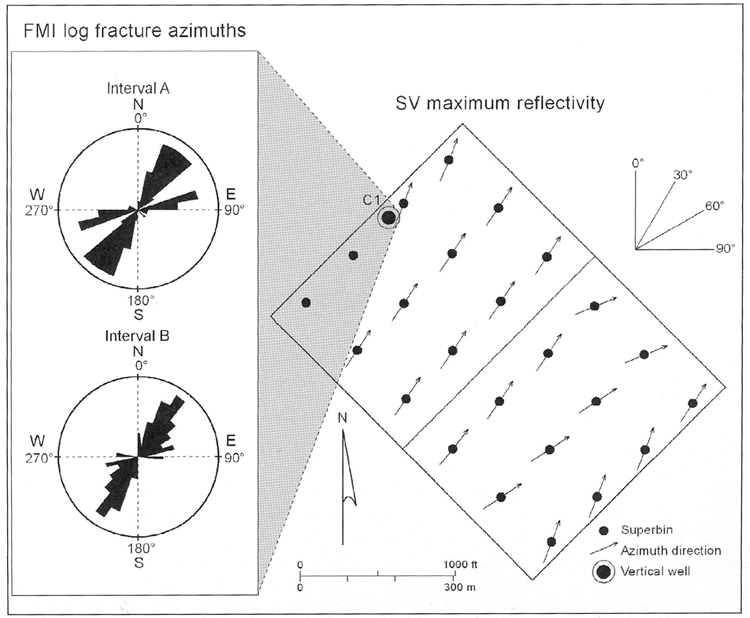
Figure 2. An azimuth-dependent analysis of PS data similar to that shown in Figure 1 was done at each location having a solid circle with an accompanying short arrow. Each arrow shows the local azi muth in which PS reflectivity from interval A was a maximum. The rose diagrams show the fracture azimuths across intervals A and B as interpreted from FMI log data acquired in well C1. The S-wave-based fracture azimuths agree closely with the FMI-based fracture azimuths and allow fracture orientation to be extended across seismic image space.