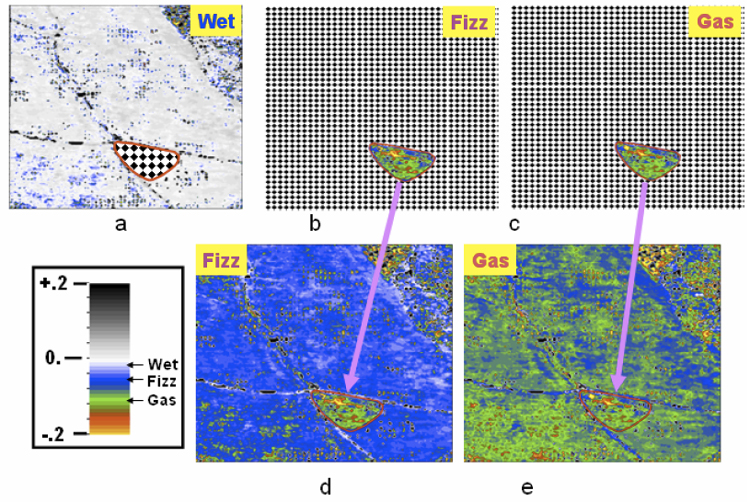
Figure 4. Field test results. Figures 4a, 4b, and 4(c) represent NIwet, NIfizz, and NIgas maps calculated by near-offset and calibrated far-offset amplitude maps (Equation 3). Figures 4d and 4e represent fizz and gas pore-fluid transforms of the wet map in Figure 4a combined with the reservoir maps in Figures 4b and 4c.