Click on image to view enlargement.
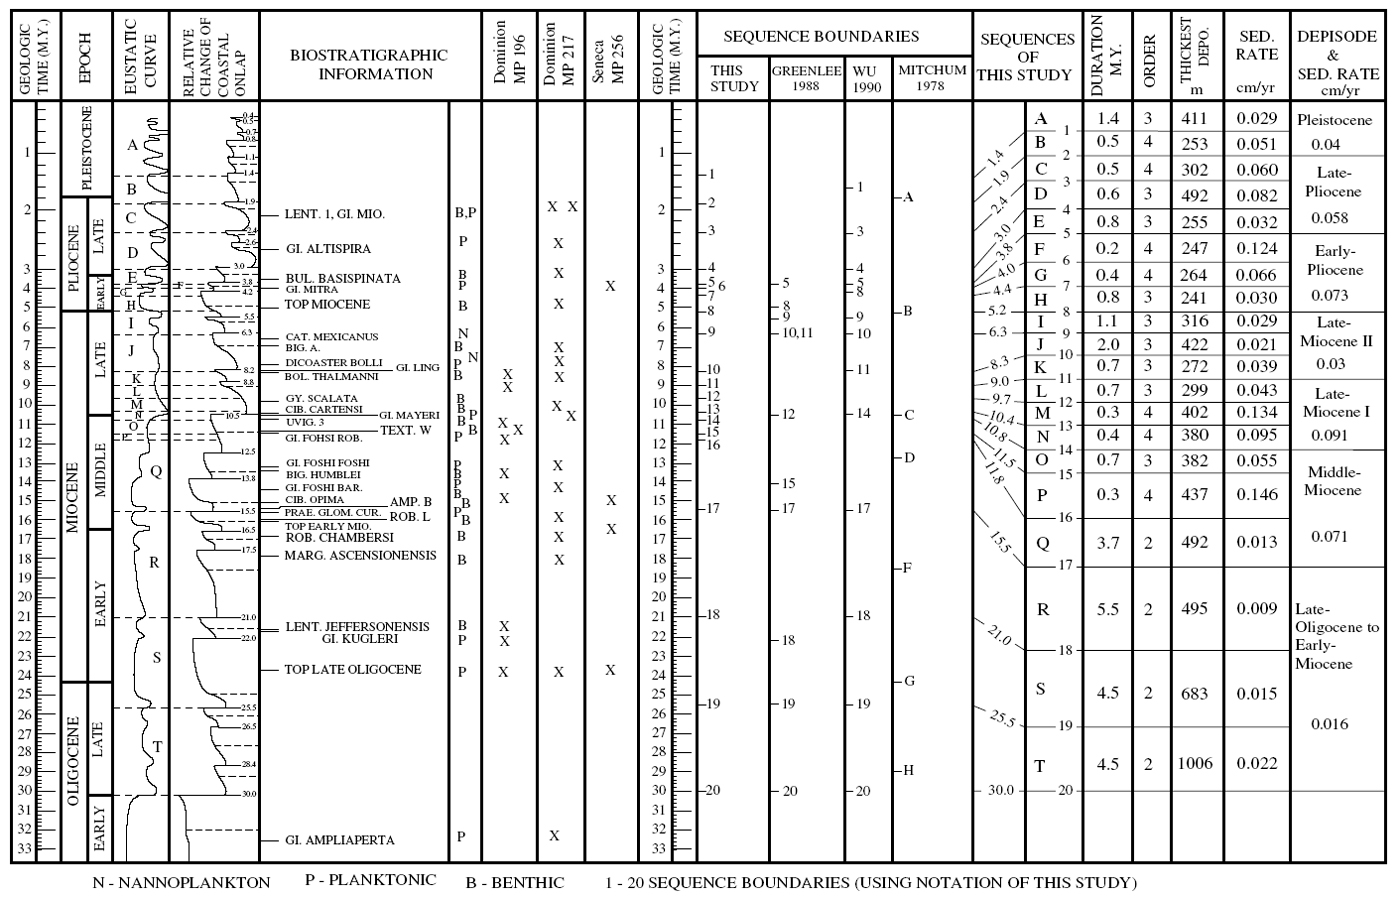
Figure 4. Chart showing biostratigraphic data (tops) available from industry wells in the Main Pass area and ages assigned to sequence boundaries of this study. Also shown are ages of sequence boundaries identified by Greenlee and Moore (1988) and Wu et al. (1990). Time scale and sea-level curve from Gulf of Mexico Chronostratigraphic Correlation Chart by Paleo-Data, Inc. and published by Schlumberger Geco-Prakla (1993). (Sequence order: 2nd 3 - 50 m.y.; 3rd 0.5 - 3 m.y.; 4th 0.08 - 0.5 m.y.; 5th 0.03 - 0.08 m.y.--Vail et al., 1991).