Click on image to view enlargement.
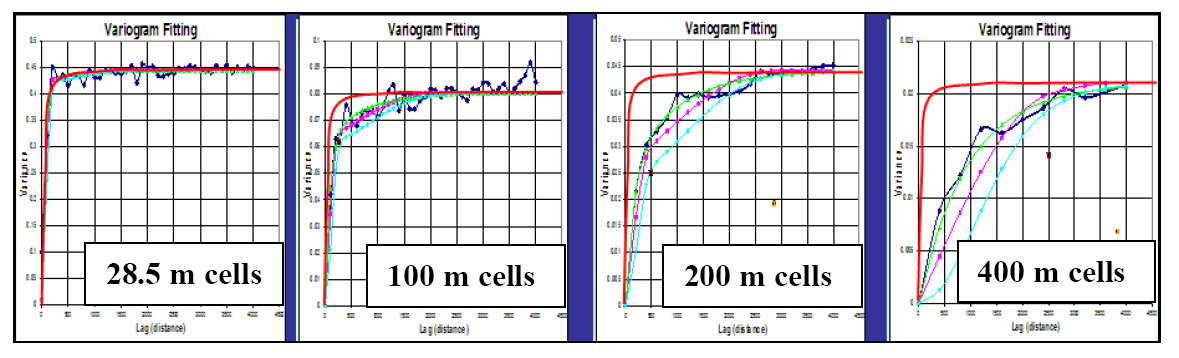
Figure 2. Semivariograms of the four cell groupings. The dark blue line is the experimental variogram, and the green, pink, and light blue curves are the Exponential, Spherical, and Gaussian variogram regressions. The red curve is the 28.5 m variogram, repeated for each cell grouping as a reference. The Exponential regression fits the experimental data best for all cell grouping sizes for this depofacies. Note that the variogram range (X axis coordinate where the variogram goes flat) increases as cell size increases. The variogram range used to model depofacies proportions should take into account the model cell size and the dimensions and spacing of the depofacies elements.