PS3-D Geological Model Building Using Remotely Sensed Satellite Data*
By
Mike Oehlers1 and Pedro Barreto1
Search and Discovery Article #40218 (2006)
Posted October 9, 2006
*Adapted from poster presentation at AAPG Annual Convention, Houston, Texas, April 9-12, 2006
Click to view posters in PDF format.
Poster 1 (~2.7 mb) Poster 2 (~3.6 mb) Poster 3 (~4.1 mb)
1NPA Group, Edenbridge, United Kingdom ([email protected])
Abstract
Recent availability of high resolution Digital Elevation Models from the SRTM mission and from SPOT Image have provided geologists with regional (90m resolution) and licence-specific (20m resolution) data sets that allow construction of 3-D models to aid hydrocarbon exploration.
At a basic level, the DEMs are used to provide good regional and detailed perspective views of structurally complex localities using imagery or geological data draped over wire-frame models derived from DEMs. The visualisations can then be “flown through,” allowing virtual field trips to demonstrate particular structural style.
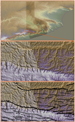
The next phase allows for extraction of dip values by relating dipping “flat irons” to slope values. Isolating true dipping surfaces and calculating dips by displaying the DEM as a slope and slope azimuth map provides structural control over large areas for a fraction of the cost of mobilising field teams in often inaccessible or hostile terrain. Using this dip data, topographic profiles are extracted from the DEM and are used with geology derived from satellite-based mapping as the basis of 2-D cross section generation, as in examples from the Zagros Mountains shown here.
In the 3-D domain, it is possible to define stratigraphic boundaries from multispectral satellite imagery and then tie the contacts to the DEM and produce a grid of elevations for a particular stratigraphic surface. These are then input into a gridding program to produce structural contour maps of important intervals near the surface, or, by means of extrapolation, deeper levels. This technique is illustrated by examples from Yemen.