Click on image to view enlargement.
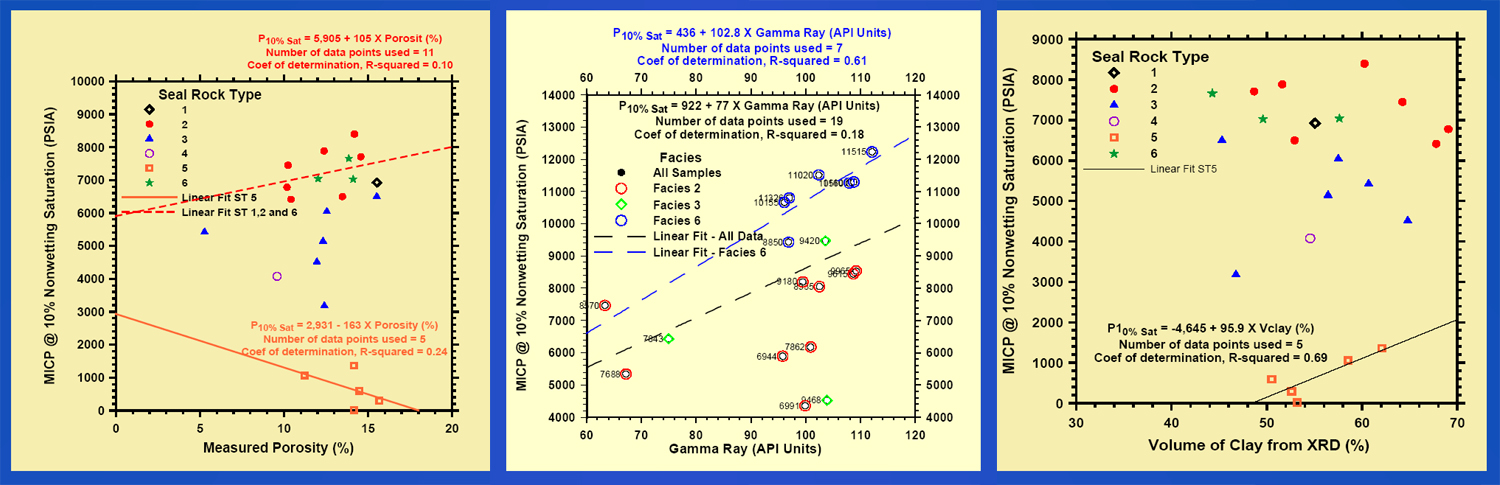
Figure 8-3. Plots of MICP data according to measured porosity, gamma ray values, and volume of clay.
Click on image to view enlargement.
Figure 8-3. Plots of MICP data according to measured porosity, gamma ray values, and volume of clay.