Click on image to view enlargement.
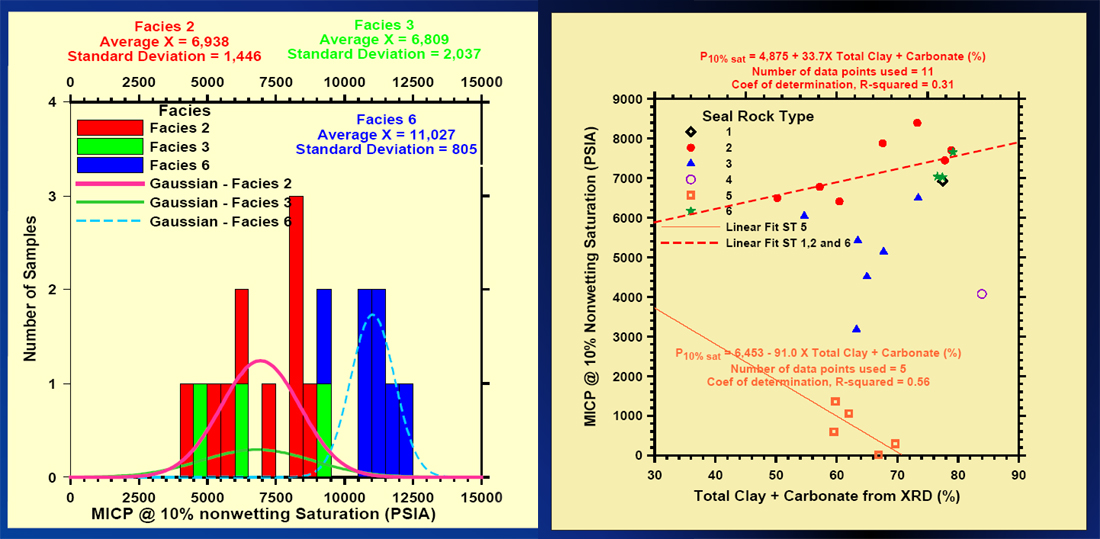
Figure 8-1. Histogram of MICP data according to shale type (facies), West Africa (Figure 6-1) and plots of MICP data according to clay and carbonate content and shale types 1-6.
Click on image to view enlargement.
Figure 8-1. Histogram of MICP data according to shale type (facies), West Africa (Figure 6-1) and plots of MICP data according to clay and carbonate content and shale types 1-6.