Click on image to view enlargement.
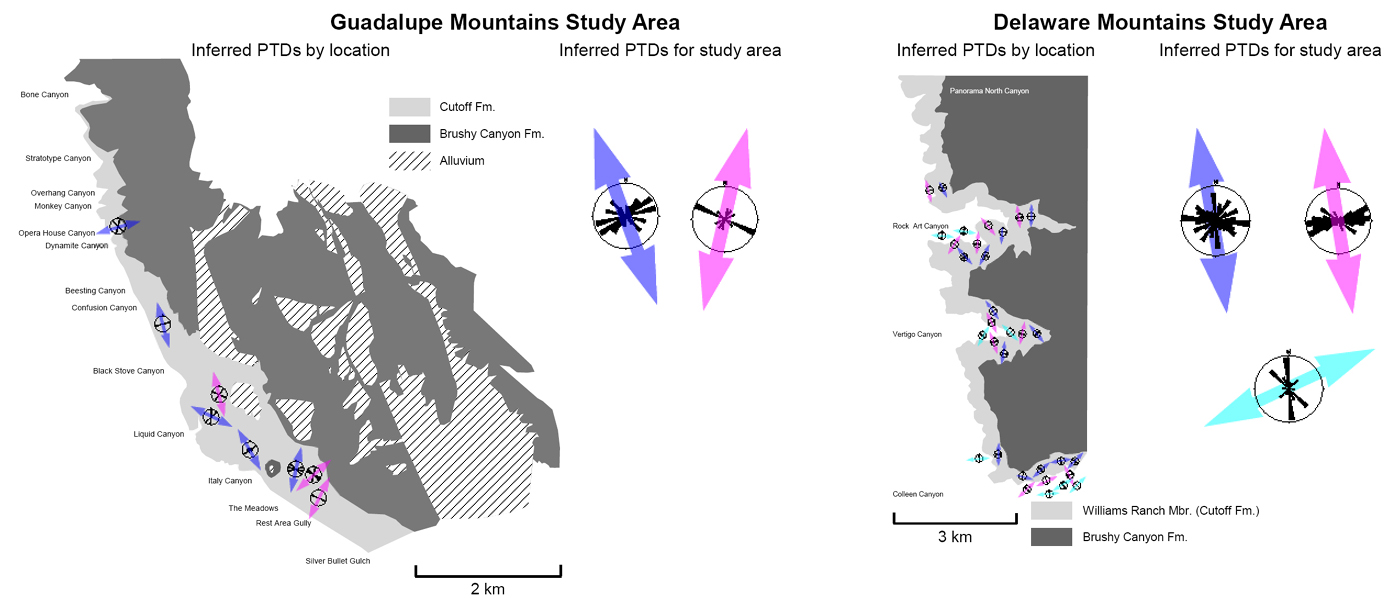
Figure 2-4. Paleo-transport directions (PTD), Williams Ranch Member (excluding Correlation Unit 6) as suggested by fold axis and lineation trends. Dark blue arrows: Average PTD based on fold axes; Violet arrows: Average PTD based on contractional lineations; Light blue arrows: Average PTD based on extensional lineations.