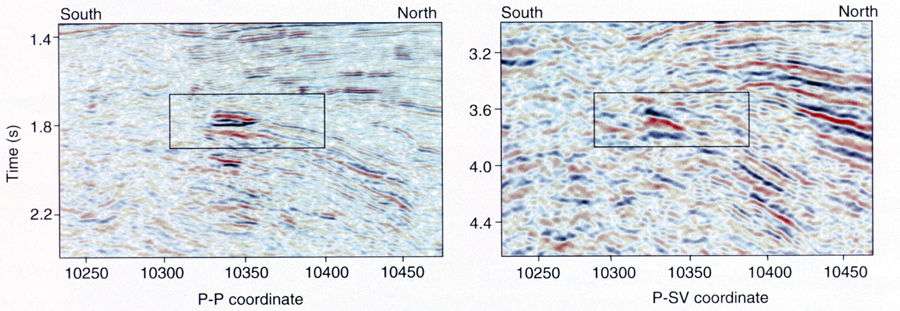
Figure 3. P-P and P-SV images of a commercial-gas reservoir. The rectangular outline is centered on the reservoir. Commercial gas produces a prominent P-P amplitude anomaly (left) and a modest P-SV amplitude anomaly (right).
Figure 3. P-P and P-SV images of a commercial-gas reservoir. The rectangular outline is centered on the reservoir. Commercial gas produces a prominent P-P amplitude anomaly (left) and a modest P-SV amplitude anomaly (right).