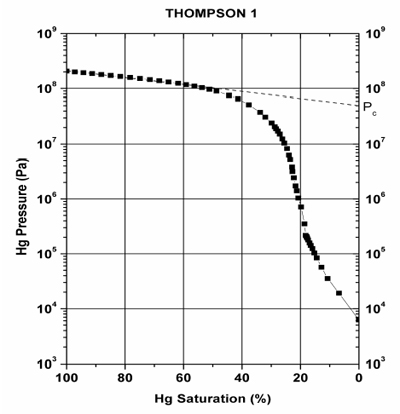
Fig. 3. Mercury pressure versus relative mercury saturation for a Pennsylvanian age shale from the Thompson 1 well in the Anadarko Basin (see Table 1). The initial increase in pressure associated with saturations below ~40% is produced by surface effects. To estimate the pore throat size, we extrapolate the plateau of the curve until it reaches the zero percent saturation and then note the associated pressure; in this example, Pc is 50.5 x 10⁶ Pa.