![]() Click
to article in PDF format.
Click
to article in PDF format.
Using An Integrated Approach to Production Optimization in A Mature Field: Burgan Field*
By
Satyendra P Sinha1, Ibrahim Al-Kandar1, and Khalaf Al-Anezi1
Search and Discovery Article 40183 (2006)
Posted January 12, 2006
*Modified from extended abstract prepared for presentation at AAPG International Conference, Paris, France, September 11-14, 2005
1Kuwait Oil Company, Ahmadi, Kuwait
Abstract
Production optimization ensures that wells and facilities are operating at their peak performance at all times to maximize production. Frequent changes in well and surface equipment down time, maintenance work, evolving reservoir conditions etc. usually make it impossible for the team to keep the asset tuned for optimal operating conditions. The current manual production optimization approaches are both time consuming and error prone due to the complexity and large volume of data that have to be considered. In the present work, several tasks and processes have been streamlined and automated with effective linkages to achieve a near real time optimization. The measure–calculate-control cycle is implemented every twenty-four hours, a procedure which maintains the system at optimal operating conditions almost all the time. Used on a daily basis to manage mature assets and make operational decisions, the system integrates production data management and reservoir modeling with transient pressure analysis, well modeling, and surface network modeling optimization. A sequential non-linear programming solver is used to optimize hundreds of critical parameters.
A multi-disciplinary team approach has been used to implement the process of production optimization using Internet, computer network, communication links, timely team meetings and corporate database. The focus has been on reducing the cycle time for conversion of data to information, decisions, and actions by developing an appropriate system. The benefits of optimization are significant. Gains include a moderate improvement in uptime, along with a significant improvement in produced volume and overall reduction of lifting and operating costs.
|
|
IntroductionGreater Burgan Field of Kuwait has nearly six decades of production history. It is currently on production through 14 Gathering Centers (GCs), over 800 wells, and more than 1400 completions. In the present work, one of the Gathering Centers was chosen to develop, test, and implement an integrated approach to production optimization. Gathering center I (GC-I) is currently producing @120 Mbopd with 56 open completions in 48 wells. The completions are distributed in five different reservoirs, namely Wara sand, Mauddud (carbonate), third sand upper, middle, and lower sand in the increasing order of depth. The depth varies from -3500 ftss to -4471 ftss, which is the original oil water contact (OOWC). The stratigraphic column of Greater Burgan is shown in Figure 1. The number of completions in each reservoir is shown in Figure 2a. There are four reservoir units in the Burgan Formation: Third Sand Upper (3SU), Third Sand Middle (3SM), Third Sand Lower (3SL), and Fourth Sand (4S). The Wara and Burgan reservoir units have the same original oil-water contact. The 3SM and 4S reservoirs are mostly massive sandstone reservoirs, whereas the Wara, 3SU, and 3SL are interbedded sandstone and shale. However, the third sand middle contributes the major bulk of production (nearly 87%) with 44 completions (Figure 2b). The present work describes the process of managing facilities, wells, surveillance, and well work with a series of automated tasks, data validation, data analysis, reservoir models, and optimization solver to achieve production optimization of GC-I (Figure 3).
Facility LimitsThe main components of facilities at GC-I are:
An outline of GC-I components is shown in Figure 4, and the schematic is presented in Figure 5. The facility limits in GC-I prove to be a bottleneck in the GC deliverability. In case adequate attention is not paid to balancing the fluid streams, it may become difficult to reach the peak performance of the GC as a whole. In GC-I the HP dry and LP dry separators can both handle 77,900 bfpd with salt up to 10 gm per thousand barrels. At present, GC-I processes dry crude of nearly 55 Mbopd. On the wet side, HP wet & LP wet separators can both handle 77,900 bfpd. Wet tank oil capacity is 91 Mbopd, and water handling capacity is limited to 27 Mbwpd. Desalter can handle 60 Mbopd. However, GC-I is currently handling 65 Mbopd and 18 Mbwpd in wet stream. A maximum of 20,700 bwpd can be disposed, 15,700 bwpd into evaporation pits and 5000 bwpd into effluent water injector wells. Transit pump capacity is 120 Mbopd, and CRU can handle 8.8 MMscfd. CRU capacity can vary from 120 Mbopd to 135 Mbopd of equivalent oil depending upon the amount of tank vapor. Six completions (3 pair of completions) have commingled flow-lines. However, in two pairs, only one completion is open, and the remaining pair has both dry completions open. Endeavor is being made to segregate this pair of ZA-18 casing & ZA-83 tubing completions perforated in Wara and Third Sand Middle reservoirs, respectively. This is expected to add 700 bopd to GC-I.
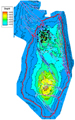
Wara Reservoir StrategyAs seen in the stratigraphic column, Wara sandstone reservoir lies at the top of the sequence. Most of the area, being distant away from the aquifer, does not have any significant energy support. More than 15% of STOOIP has been produced from the reservoir causing the reservoir pressure to decline below the saturation pressure. This has resulted in high gas saturation largely in the updip part of the reservoir, and many high GOR wells are being shut-in. The off-take is being closely regulated to prevent any further decline in the reservoir pressure. For this purpose, GC-I area along with another GC area has been studied to identify pressure compartments. Current pressure level has been estimated for each of these compartments. The compartments named as regions are shown in Figure 6. Also shown is the gas-oil-contact on the map and the faults. To determine the desirable off-take rate for each region, a plot of rate and pressure has been made with time on x-axis (Figure 7). The rate at which the pressure appears to have been stabilized over a period was identified. Based on the PVT data and producing GOR, the corresponding subsurface rate has been calculated. This becomes the target subsurface rate for the region. The current subsurface rate is computed for the region. Wells are examined in detail for their performance behavior, and their recommended rates are matched to achieve the target subsurface rate for the compartment. Based on the study, three Wara completions were shut-in, and oil rates were revised in other completions to a rate of 7500 bopd from eight completions. This has saved nearly 10 MMscfd of gas from being bled off. The shut-in bottom-hole pressure measurements are planned to assess the pressure behavior. Daily Production MonitoringEvery morning, the GC Petroleum Engineer reviews the daily night figures of production, dispatch, and stock. The figures are accessed online using KOC Geoportal. These figures are matched with the calculated rate of all the open completions based on the flowing hours. The ratio, i.e. allocation factor for GC, is calculated. The calculations have been automated using live links. The allocation factor for GC-I has been range bound and provides good control on the production management of the GC-I (Figure 8). However, nearly 10-15% open completions do not have test data for the last six months. The production supervisor has been urged to schedule these completions on priority. In addition to the GC allocation factor for oil, daily dry oil, wet oil, water, and gas is being tallied and reconciled with test data.
Daily ReportsThe team has developed a set of daily reports that are reviewed every morning. · GC-I current report well data · GC-I current daily crude volume report · Daily wireline and surveillance report · Rig activity daily progress report
Data Validation/ActionThe following sets of data are validated every morning with the help of all the team members including G&G, RE, and PE. The data are checked in the living models for any new information, as well as for data validation.
· SBHP · FBHP · Portable test · Pressure Build-up · Pressure Fall-off · PLT
AlertsGeoportal has been set up to generate alerts transmitted by e-mail to all the GC team members for calling priority review and actions. The alerts are generated whenever:
Optimizing Dry Oil ProductionWet Wells with High Salt/Low Water CutIn GC-I, 11 wet completions are shut-in with a production potential of 20 Mbopd. At the same time, there are several completions with low water cut and/or high salt. Two such completions were reviewed in detail and were restored as dry wells, adding a production potential of 9000 bopd without incurring any loss of production on the wet side.
Swing Producers IdentificationThe identification of swing producers is based on low salt, massive oil column, and a gap of more than 40 ft between the bottom of perforation to the current OWC.
short
A total of 3050 bopd swing production has been identified for GC-I.
Rate Sensitive Wet WellsA review of well log, perforation and well production performance can easily reveal the feasibility of increasing the rates in wet wells. Wells with low oil columns are not recommended for rate increase. Four wet completions were identified for choke up resulting in an increase of 2400 bopd.
Production OptimizationThe facility diagram for GC-I is shown in Figure 9. An objective function is defined for the purpose that the optimizer tries to solve by changing the actions and honoring the entire well and facility constraints. In case of GC-I, the current objective function is to set GC oil production to a value of 120 Mbopd. Actions that can be changed include open, close, or open restricted. Constraints include all the facility limits of oil, water processing, and well allowable. Once facility upgrades are done in 2007; the objective function would be to maximize GC oil target rate, and the solver parameters may appear to be as shown in Figure 10. The results show that GC-I can meet its current target of 120 Mbopd. The GC has a production potential of 154 Mbopd without facility limits.
· With an integrated team approach, Geoportal with the development of automated tasks and alerts can make real-time production optimization a reality. The wells and reservoirs can be managed efficiently and the facilities can perform at their peak.
Our special thanks to the Kuwait Oil Ministry for approval of the abstract and the Kuwait Oil Company for according permission to carry out this work and prepare this technical paper. Our thanks are due to Hashem Hashem, Manager, Field Development, SEK, and Ibrahim A. Karim, Team Leader, Field Development, EK, for their constant support. Thanks are due to Mas Budi for his positive comments and fruitful suggestions. Authors are profoundly thankful to Ms. Raghad Al-Qattan and Athari for valuable RE and general support, and to Harshad Gandhi for critical PE support. Thanks are also due to Hamdah Al-Enezi for G&G and Abdullah H. Al-Kandari for production operation support. |