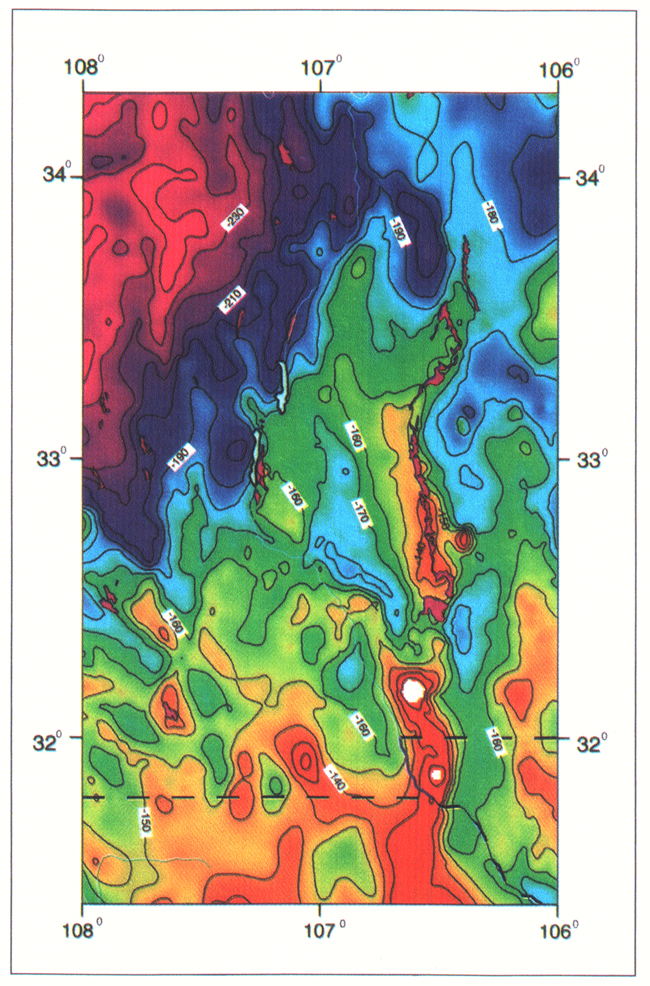
Figure 2. Bouguer gravity anomaly map of the southern Rio Grande rift. Contour interval is 10 milligals. Precambrian basement outcrops are shown in magenta.
Figure 2. Bouguer gravity anomaly map of the southern Rio Grande rift. Contour interval is 10 milligals. Precambrian basement outcrops are shown in magenta.