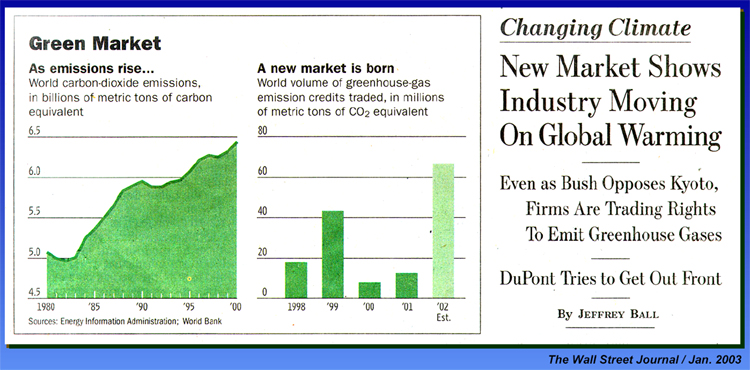
Figure 56. Plot of world carbon-dioxide emissions, in billions of metric tons of carbon equivalent (left). Plot of world volume of greenhouse-gas emission credits traded, in millions of metric tons of CO2 equivalent (right).
Figure 56. Plot of world carbon-dioxide emissions, in billions of metric tons of carbon equivalent (left). Plot of world volume of greenhouse-gas emission credits traded, in millions of metric tons of CO2 equivalent (right).