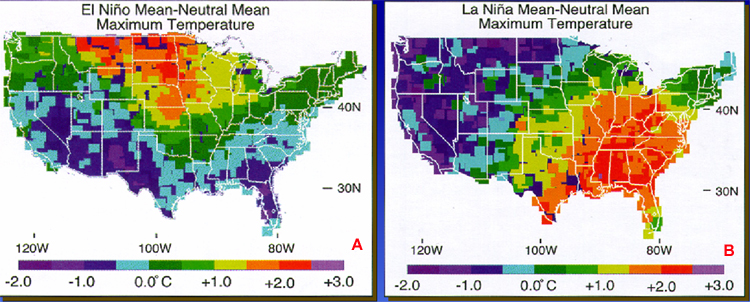
Figure 44. A. Map showing typical temperature anomalies during December, January, and February of nine El Niño phases, 1947-1987. Temperatures were warmer than normal in the north central (Great Lakes) region and colder than normal in the southwestern and southeastern U.S. (From NOAA--http://www.pmel.noaa.gov/toga-tao/el-nin/gif/fst-temp-us-big.gif; Sittel, 1994.) B. Map showing typical temperature anomalies during December, January, and February of twelve El Niña phases, 1947-1987. Temperatures were colder than normal in the northwestern U.S. and warmer than normal in the central and southeastern U.S. during these La Niña events. (From Sittel, 1994; http://www.coaps.fsu.edu/research/matt/maxtdjf.dv.gif.)