Click on image for enlargement.
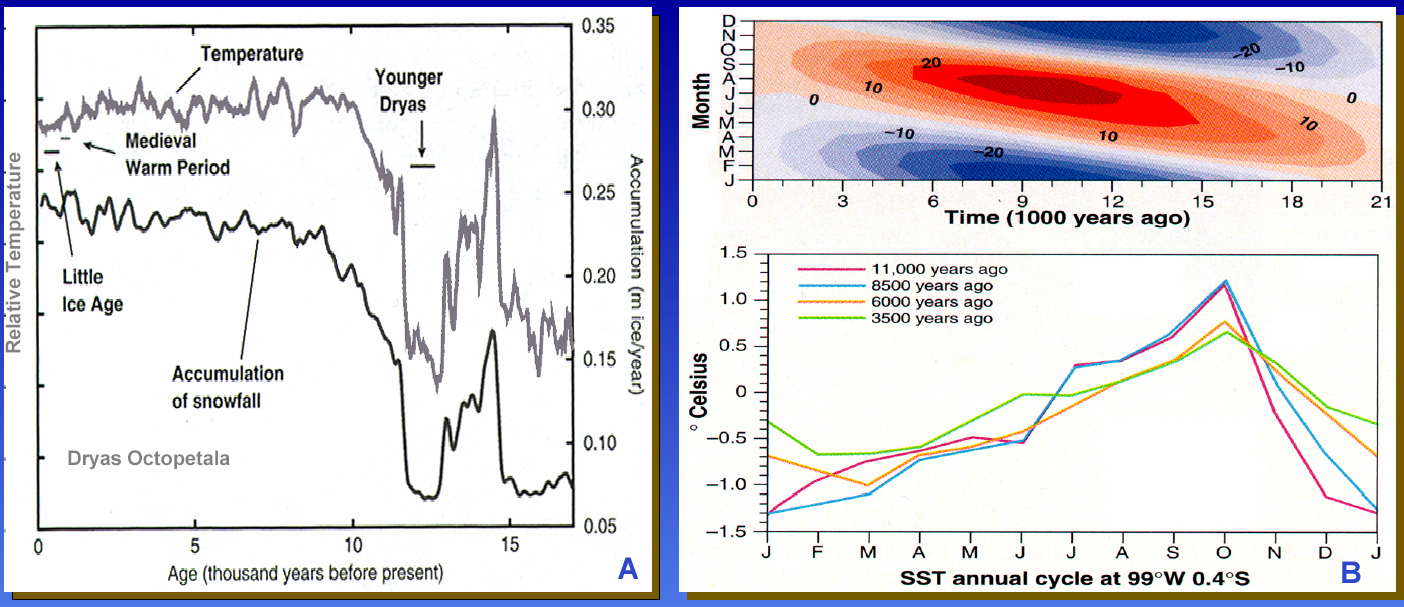
Figure 33. How solar cycles affect climate. A. Relative temperature and accumulation of snowfall plotted against age (thousands of years before the present) (after Cuffey and Clow, 1997; Alley et al., 1997, with permission of Geological Society of America). B. Top: Variations in solar radiation received at the top of Earth's atmosphere relative to present day in W/m2 as a function of time of year and for thousands of years in the past. Bottom: Changes in SST near the equator in the Eastern Pacific at 99°W, 0.4°S for times in the past as given, based on changes simulated in the CCSM relative to 1800 A.D. (From Trenberth and Otto-Bliesner, 2003, with permission of Science.)