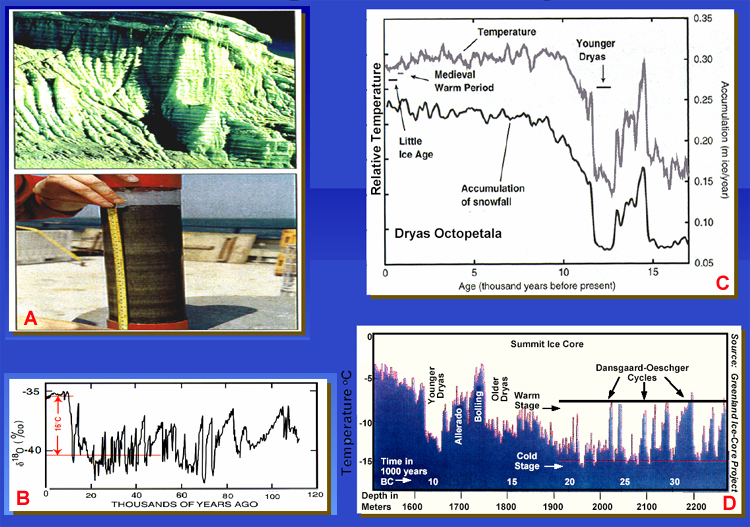
Figure 32. Climate recordings in the cryosphere. A. Top: Ice sheets reveal annual layers, which scientists can analyze to reconstruct the history of precipitation and air temperatures 100,000 years into the past. Bottom: Cores of seafloor sediments reveal the climate history of the ocean. (from Gagosian, 2002). B. The pattern of temperature change over the last 110,000 years as recorded by the 18O to 16O ratio in Greenland ice (Dansgaard et al., 1993). The absolute temperature range has been independently determined from the temperature profile measured in the borehole (Cuffey et al., 1994). C. Relative temperature and accumulation of snowfall plotted against age (thousands of years before the present) (after Cuffey and Clow, 1997; Alley et al., 1997, with permission of Geological Society of America). D. The most recently published data from the newest Greenland ice cores (Johnsen et al., 1992). Note the significantly greater resolution. Temperatures are interpreted from dD and 18O. At the height of the last glacial maximum approximately 18 Ka, temperatures were approximately 12-13oC cooler than present, a slightly more extreme difference than observed in the Antarctic cores. (After Kerr, 1993, with permission of Science.)