Click on image for enlargement.
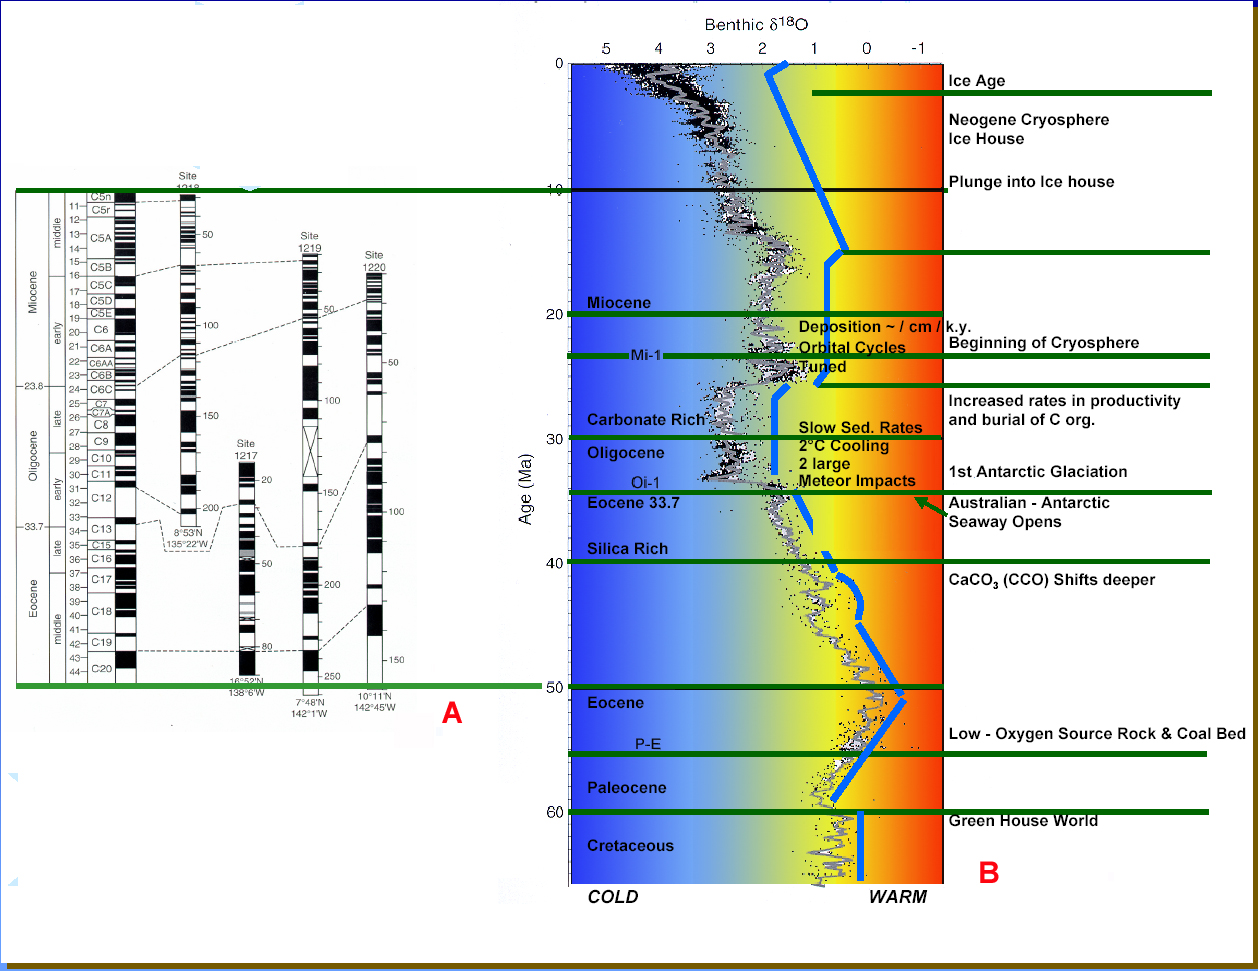
Figure 31. Isotopic climate indicators (after Lyle, 2002). A. Synthesis of magnetic stratigraphy from four Leg 199 drill sites. Depth scale in med is shown on the right of each column, and geographic coordinates are shown at the bottom of each column. Black = normal magnetic polarity, white = reversed magnetic polarity, gray = no polarity assignment possible. Crosses = intervals with no data, dashed lines = correlation between selected chrons to the GPTS (Cande and Kent, 1995). B. Compilation of benthic oxygen isotope data for the Cenozoic (Zachos et al., 2001). Also shown is the time window investigated during ODP Leg 199 and the position of three major events targeted by the leg. P/E = Paleocene / Eocene boundary and its associated thermal event. Oi-1 is approximately at the E/O boundary and marks the first major Antarctic glaciation. Mi-1 is near the O/M boundary and marks the beginning of the development of the Neogene cryosphere.