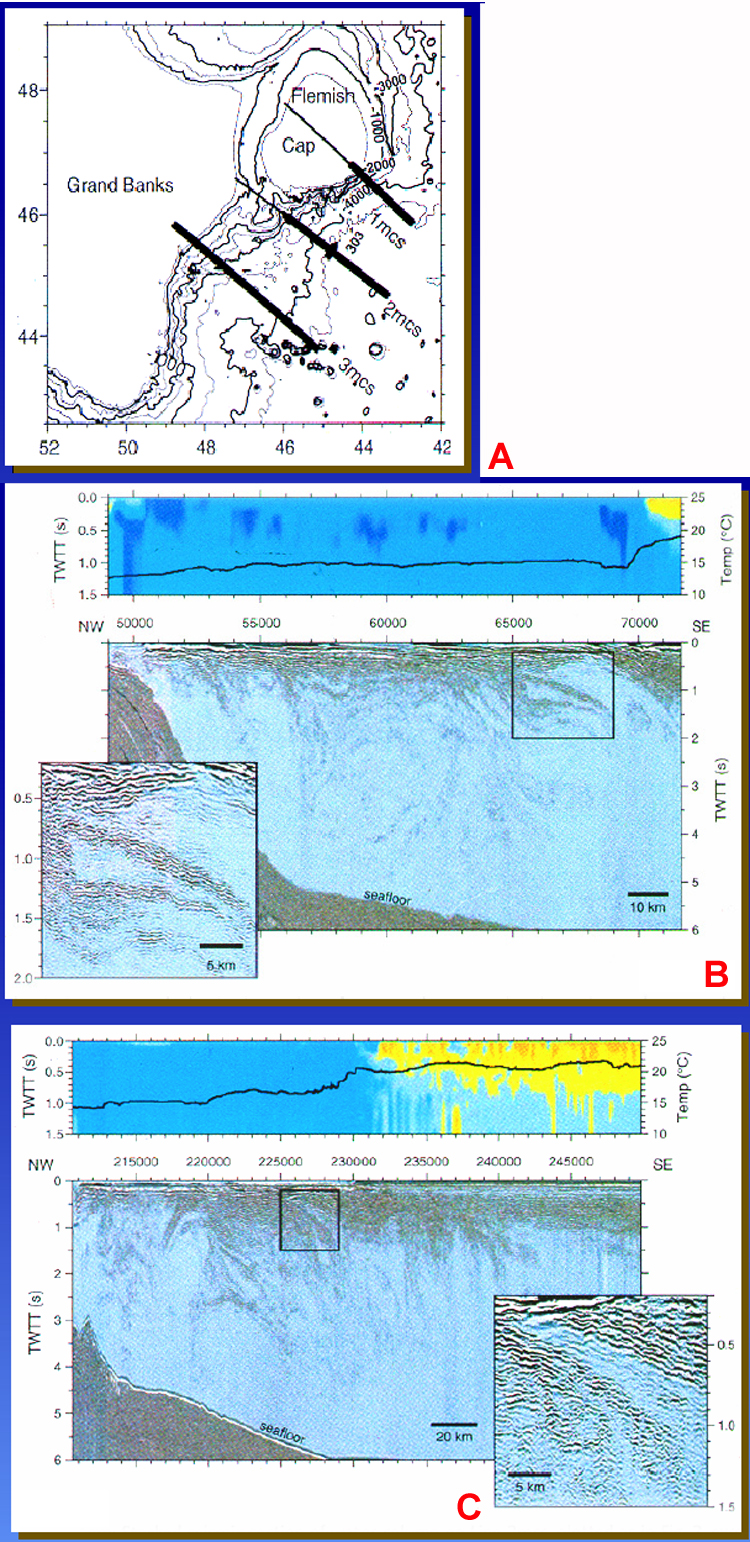
Figure 28. Thermohaline fine structure in an oceanographic front from seismic refection profiling (from Holbrook et al., 2003, with permission of Science). A. Location of seismic lines in the Newfoundland Basin. Bold lines show portions of seismic lines shown in B and C. B. Bottom: Stacked seismic section of water column on line 1mcs. Image has a vertical exaggeration of 16. Vertical axis is two-way travel time (TWTT) in seconds; the base of the section at 6 s corresponds to a depth of ~4500 m in the ocean. Horizontal axis is in CMP; CMP spacing is 6.25 m. Box denotes portion of profile depicted in inset, which shows coherent "slabs" penetrating to ~1000 m depth. Top: Color-coded plot of stacking sound speed in the ocean, which is approximately equal to root-mean square sound speed. Cold colors correspond to low sound speed (minimum of ~1440 m/s); warm colors reflect higher sound speed (maximum of ~1530 m/s); boundary between blue and yellow is 1505 m/s. A plot of SST measured during the seismic survey is superimposed; the front between the LC and NAC is visible as an abrupt ~5°C increase in temperature at CMP 69500. C. Bottom: Stacked seismic section of water column on line 2mcs, plotted as in B, except with vertical exaggeration of 27. Box denotes portion of profile depicted in inset, which shows "slabs" losing coherency at depths of ~1000 m. Top: Stacking sound speed in the ocean, which is approximately equal to root-mean-square sound speed and SST, plotted as in B. The front is visible at CMP 229000.