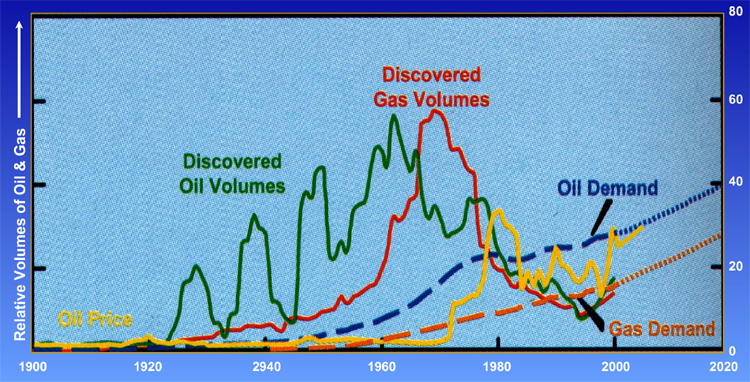
Figure 16. Plot of oil price, oil demand and discovered volumes, with and gas demand and discovered volumes (in billions of oil-equivalent barrels / US dollars--relative numbers, from 1900 to 2020).
Figure 16. Plot of oil price, oil demand and discovered volumes, with and gas demand and discovered volumes (in billions of oil-equivalent barrels / US dollars--relative numbers, from 1900 to 2020).