--> Iso-frame Modeling of Marly Chalk and Calcareous Shale, by Ida Lykke Fabricius, Manika Prasad, and Casper Olsen, #40151 (2005).

Datapages, Inc.Print this page

Click to article in PDF format.


Iso-frame Modeling of Marly Chalk and Calcareous Shale.

By

Ida Lykke Fabricius1, Manika Prasad2, and Casper Olsen1 

Search and Discovery Article #40151 (2005)

Posted May 1, 2005


*Adapted from extended abstract, prepared by the authors for presentation at AAPG International Conference & Exhibition, Cancun, Mexico, October 24-27, 2004.


1E&R, DTU, Bygningstorvet 115, DK-2800 Kgs. Lyngby, Denmark ([email protected])

2SRB Project, Geophysics Department, Stanford University, Stanford, CA 94350, USA ([email protected])  


Summary Statement 

We show iso-frame model calculations for chalks and compare them to sediment models developed mainly for granular media. The iso-frame model helps to explain the effects of clay on velocity variations in carbonate sediments.


uSummary

uFigure captions

uStudy area

uResults

uAcknowledgments

uReferences


uSummary

uFigure captions

uStudy area

uResults

uAcknowledgments

uReferences


uSummary

uFigure captions

uStudy area

uResults

uAcknowledgments

uReferences


uSummary

uFigure captions

uStudy area

uResults

uAcknowledgments

uReferences


Figure and Table Captions

Figure 1. Location of the six wells studied in the Valdemar field, Danish North Sea (modified after Jacobsen et al., 2004). 

Figure 2a. Argillaceous chalk with 37.9% porosity, 0.7 mD permeability, and 79.8% carbonate. The non-carbonate components are predominantly kaolinite and illite-smectite.

Figure 2b. Highly argillaceous chalk - Marly chalk with 26.7% porosity, 0.1 mD permeability, and 60.8% carbonate. The non-carbonate components are predominantly quartz, kaolinite, and illite-smectite.

Figure 2c. Calcareous shale with 17.5% porosity, permeability below 0.02 mD, and 3.2% carbonate. The non-carbonate components are predominantly kaolinite and illite-smectite.

Figure 3a. Water saturation as function of porosity. Logging data from the wells Bo-1, NJens- 1, Valdemar-1p, Valdemar-2p, Valdemar 3-p, and Valdemar-4. Low-water saturation is found in porous intervals.

Figure 3b. P-wave velocity is negatively related to porosity.

Figure 3c. High P-wave velocity is mainly found in intervals with low insoluble residue.

Figure 4. Iso-frame model of chalk (Fabricius, 2003). The iso-frame model is an effective medium model based on modified upper Hashin-Shtrikman (MUHS) bounds of Nur et al. (1998). Sketch to the right shows how a part of the solid (including calcite (white) and silicates (gray)) are suspended in pore-fluid (black), and how the suspension is embedded in the supporting frame of calcite (white) and silicates (grey). Samples with the same fraction of solid in frame but with varying porosity fall along one iso-frame curve in an elastic modulus-porosity plot (left). The MUHS bounds are calculated from:


 MHS+ = KHS+ + 4/3GHS± , where K1 and K2 are bulk moduli of individual phases G1 and G2 are shear moduli of individual phases. f1 and f2 are volume fractions of individual phases normalized to a critical porosity, φc. The upper bound is defined when 1 is the stiffest component and 2 the softest, For the IF model, the suspension (termed 2) is imbedded in the mineral frame (termed 1): f1 = (IF)(φc-φ)/φc f2 = (φ + (1−IF)(φc-φ))/φc, where IF is a fraction between 0 and 1.

Figure 5a. Iso-frame value is negatively related to porosity.

Figure 5b. Iso-frame value is positively related to P-wave velocity.

Figure 5c. Iso-frame value seems to have a minimum around 40% insoluble residue.

Return to top.


Study Area and Data 

Valdemar field in the North Sea is a low-relief marly chalk structure, sealed from the overlying Chalk by a calcareous shale (Figures 1, 2a, 2b, 2c). We studied core-calibrated well log data representing a range in clay content from pure chalk to pure shale over a depth interval of 200 m.
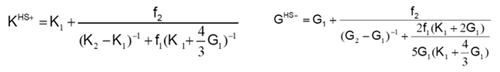
 

Results 

For the pure chalk the acoustic velocity varies widely: from 2 to 4 km/s, whereas the range gradually narrows with increasing clay content to 2 to 3 km/s for intervals with more than 60% clay. The velocity variation is largely a reflection of the porosity: in pure chalk, porosity varies between 15% and nearly 50%, whereas the range narrows to 15%-35% in clay-rich intervals (Figure 3a, 3b, 3c). In order to assess the influence of clay on velocity we thus need a porosity-independent measure.  

We calculated iso-frame (IF) values based on modified upper Hashin-Shtrikman bounds (Figure 4). IF indicates (on a scale from 0 to 1) to which extent the solids are part of the load-supporting frame of the sediment. For the pure chalk, IF varies from 0.4 to 0.7. IF decreases with increasing clay content to a low of 0.1 - 0.5 at 40% clay and from there increases with increasing clay-content to 0.6 to 1.0 at 90% clay. Thus, up to 40% clay softens the chalk; more clay stiffens the sediment (Figure 5a, 5b, 5c).


Acknowledgments 

Log and core data were kindly provided by Mærsk Oil and Gas AS. Core and pore fluid data were kindly provided by Geological Survey of Denmark and Greenland. Joint Chalk Research is thanked for financial support.


References 

Fabricius, I.L., 2003, How burial diagenesis of chalk sediments controls sonic velocity and porosity: AAPG Bulletin, v. 87, p. 1755-1778.

Jakobsen, F., J.R. Inseon, L. Kristensen, and L. Stemmerik, 2004, Characterisation and zonation of a marly chalk reservoir: the Lower Cretaceous Valdemar Field of the Danish Central Graben: Petroleum Geoscience, v. 10, p. 21-33.

Nur, A., G. Mavko, J. Dvorkin, and D. Galmudi, 1998, Critical porosity: a key to relating physical properties to porosity in rocks: The Leading Edge, v. 17, p. 357-362.


Return to top.