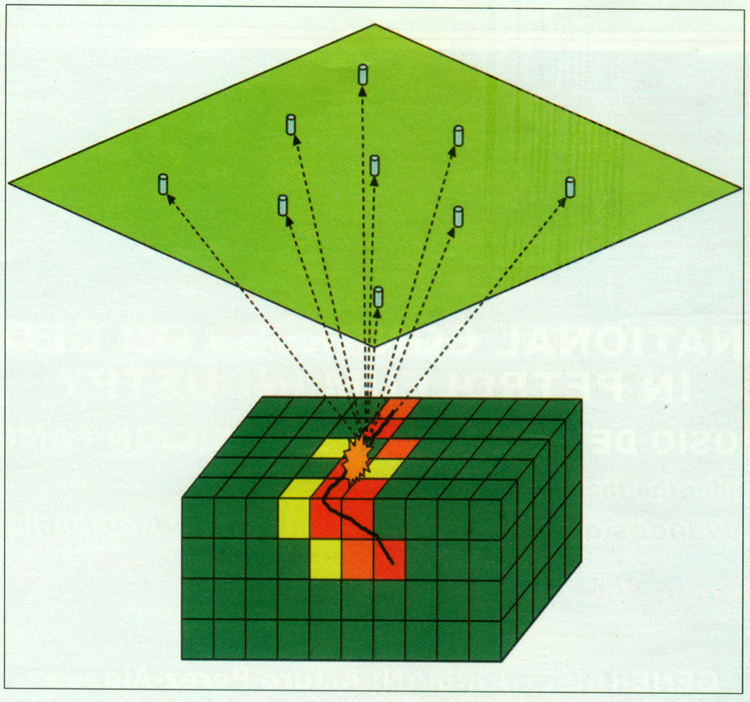
Figure 2. Illustration of the surface method of emission tomography. Movement on the fault causes a seismic signal that is recorded on the surface array. The array is beam-steered sequentially at each cell in the subsurface. The seismic energy recorded by the array over a period of observation time is displayed as colors in the cube, hotter colors representing higher energy levels. The areas of high energy will delineate where dynamic activity is taking place.