Click on image to enlarge.
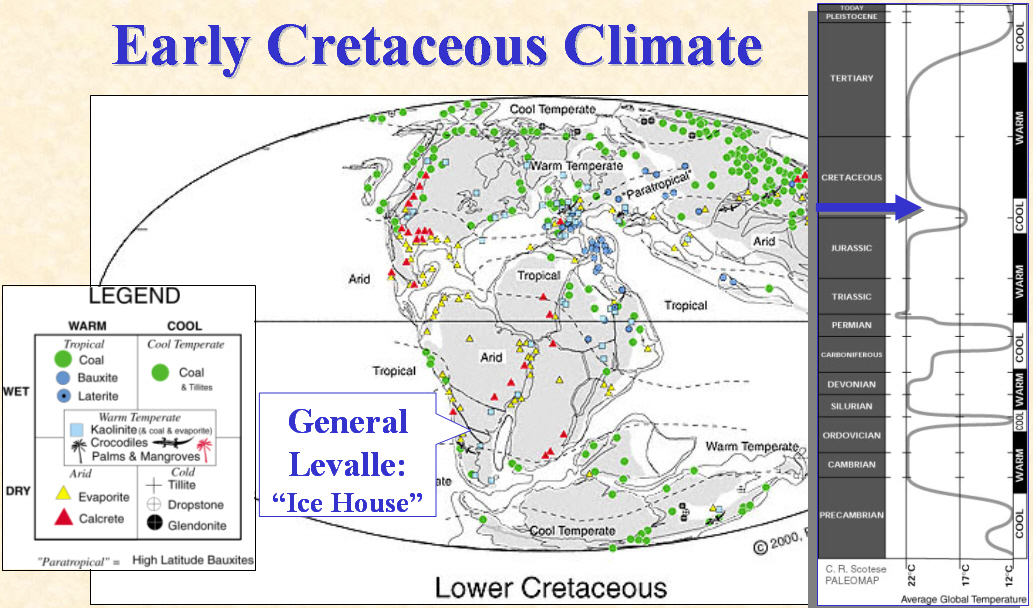
Figure 2.9. Early Cretaceous climate, with temperature indicators presented on a global paleogeographic map, along with plot of temperature through geologic time (Images from Christopher Scotese, The Paleomap Project, http://www.scotese.com/ecretcli.htm, and presented with kind permission of Dr. Scotese.)