Click image for enlargement.
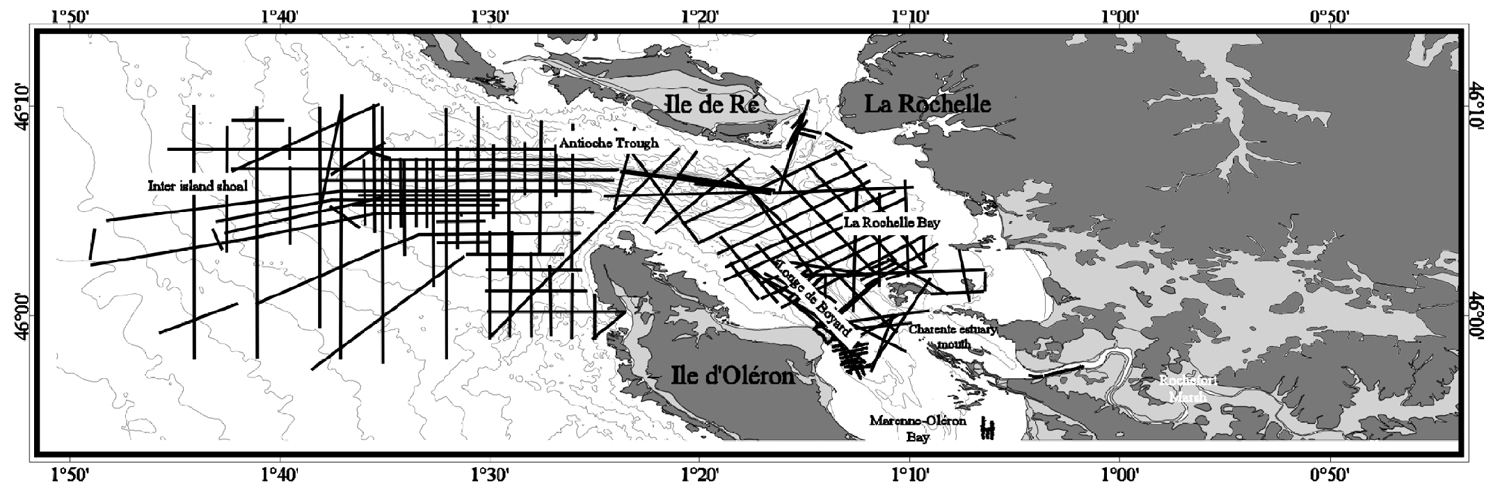
Figure 1. Simplified bathymetric map (SHOM data) showing the general location of the study area. Seismic profiles are indicated by line segments.
Click image for enlargement.
Figure 1. Simplified bathymetric map (SHOM data) showing the general location of the study area. Seismic profiles are indicated by line segments.