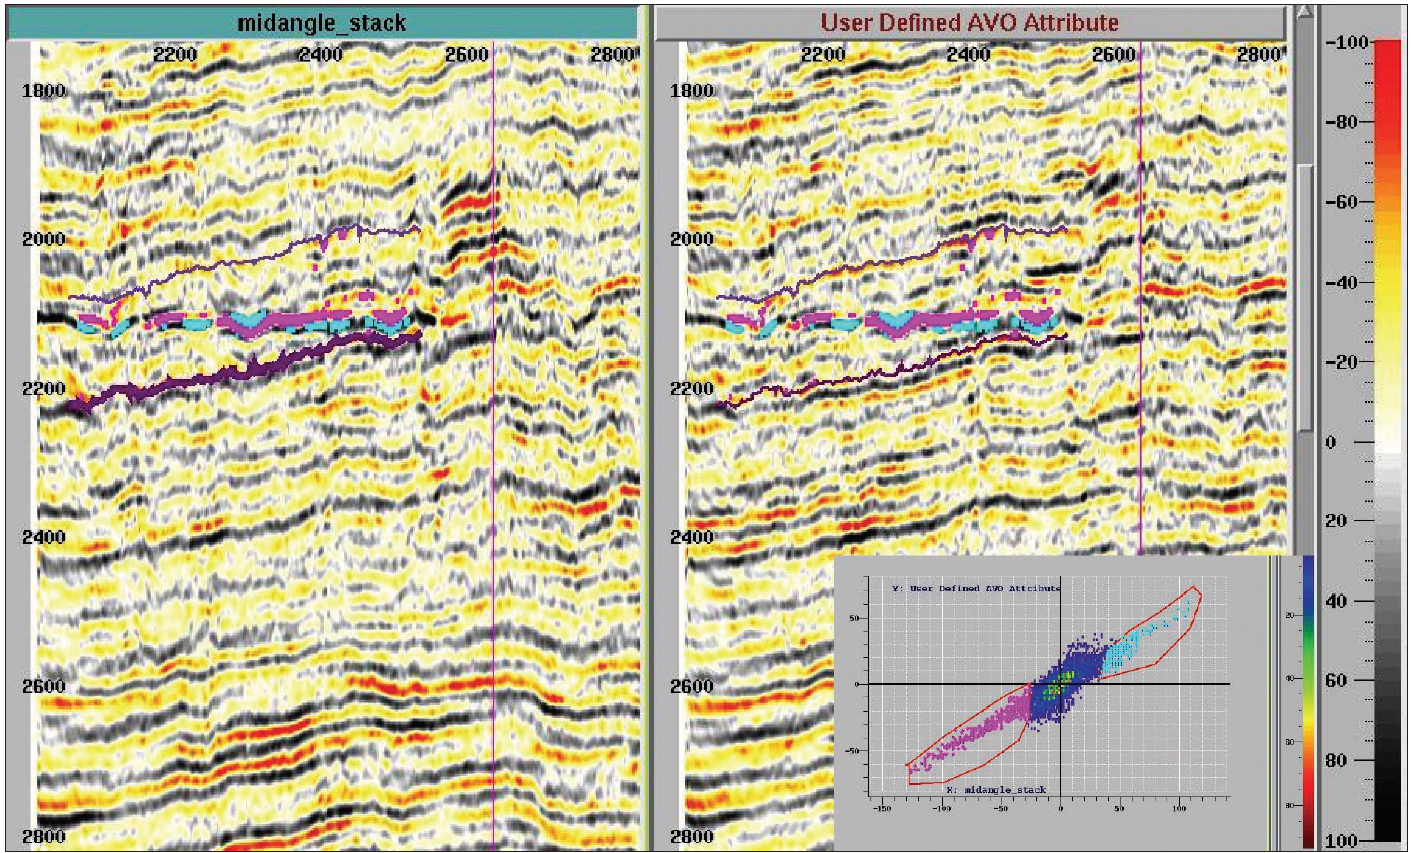
Figure 4. A single line near the southern end of the survey shows some of the AVO characteristics of the anomaly. The section on the left (A) is from the mid angle stack, while the section on the right (B) is from the full stack. Data between the two interpreted horizons was used to generate the crossplot in the lower right corner. When the anomalous crossplot amplitudes are posted back onto the sections they highlight the flat spot. This figure implies about a 120-meter hydrocarbon column height if the flat spot is a fluid contact.
Click on image to view enlargement.
Click to view in sequence seismic line from midangle stack and full stack.