Click on image for enlargement.
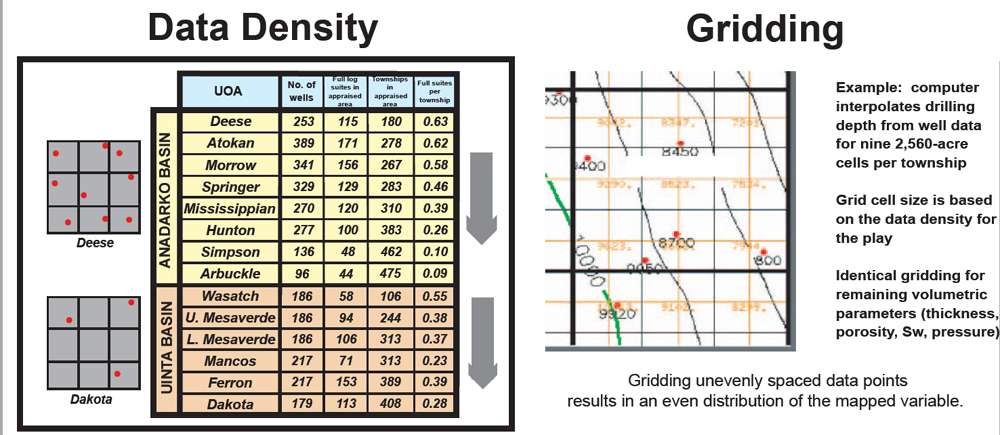
Figure 3.4. Example of gridding, with chart of data density (from Figure 1.14). Computer interpolates drilling depth from well data for nine 2,560-acre cells per township. Grid cell size is based on the data density for the play. There is identical gridding for remaining volumetric parameters (thickness, porosity, Sw, pressure).