Click on image to view enlargement.
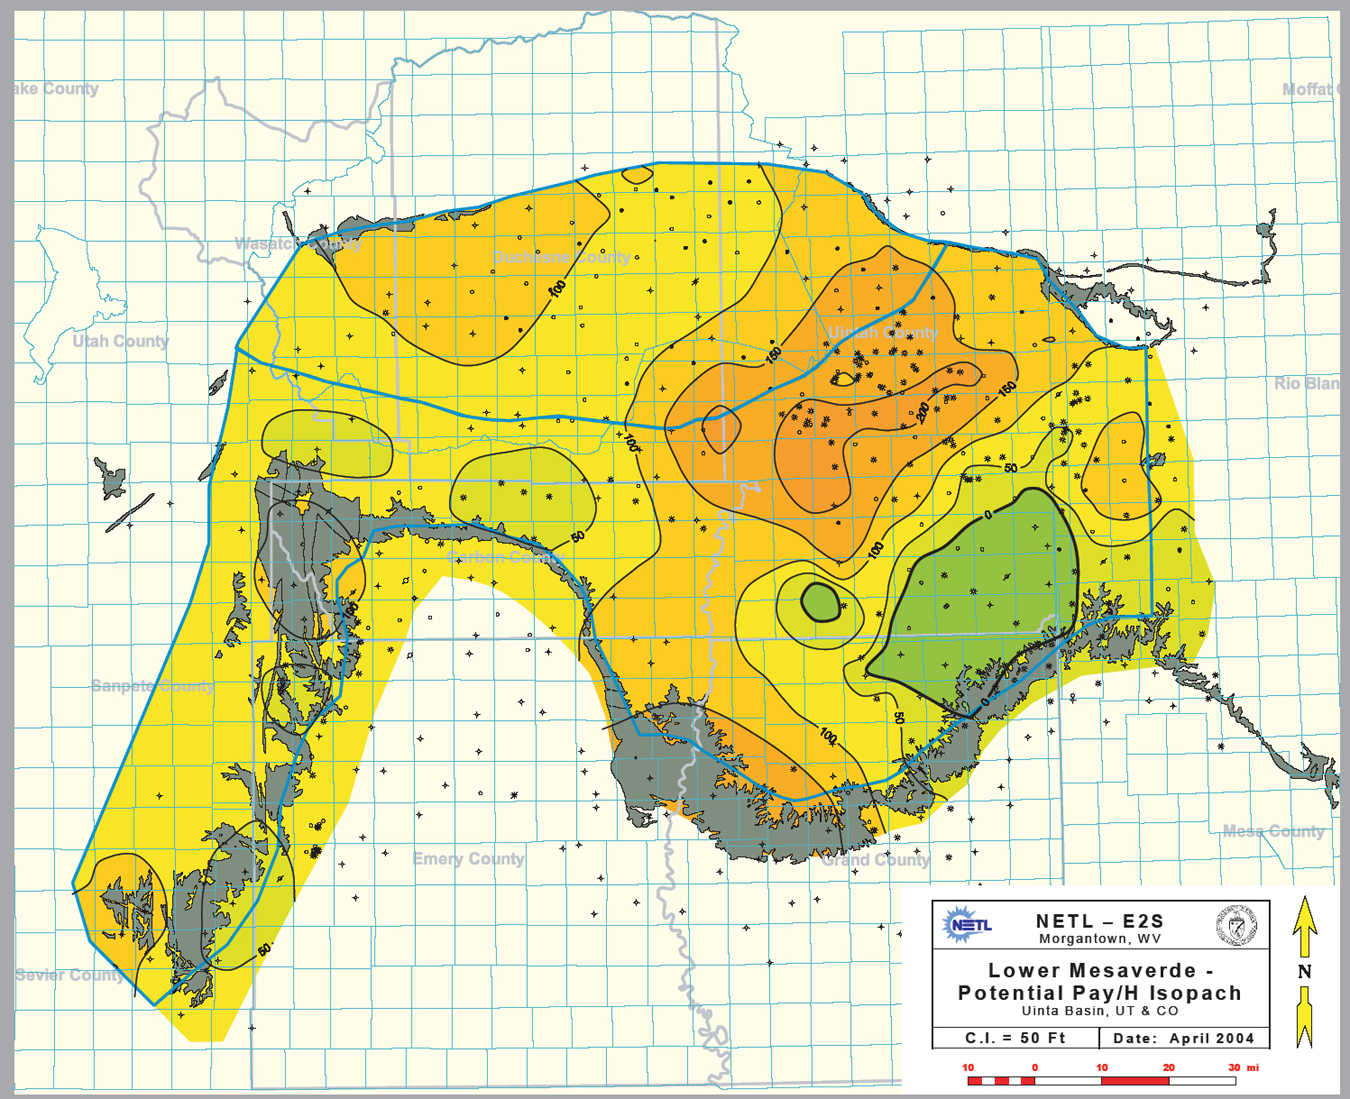
Figure 2.8. Lower Mesaverde UOA potential pay/H map showing the geographic distribution of sandstone with porosity > 4% for the UOA. Areas with Sw >= 70% are viewed as 0 potential pay/H. Note that "potential pay" does not equal "economically recoverable."
Click to view sequence of Lower Mesaverde UOA maps.