Click on image to view enlargement.
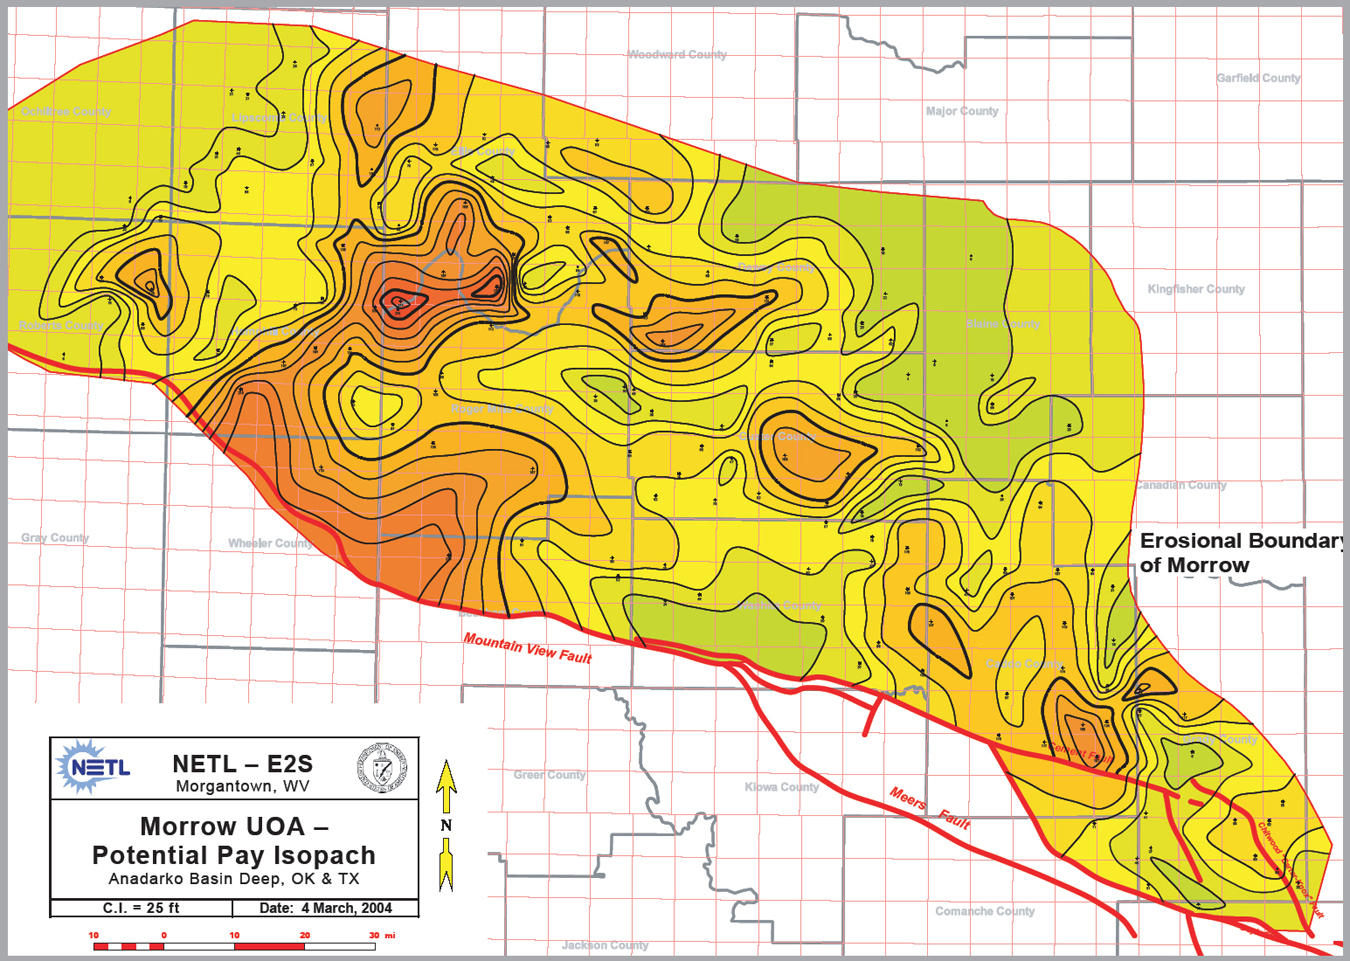
Figure 2.3. Morrow UOA potential pay map showing the geographic distribution of sandstone porosity >4% for the UOA. Note that "potential pay" does not equal "economically recoverable."
Click to view sequence of Morrow UOA maps.