Click on image to view enlargement.
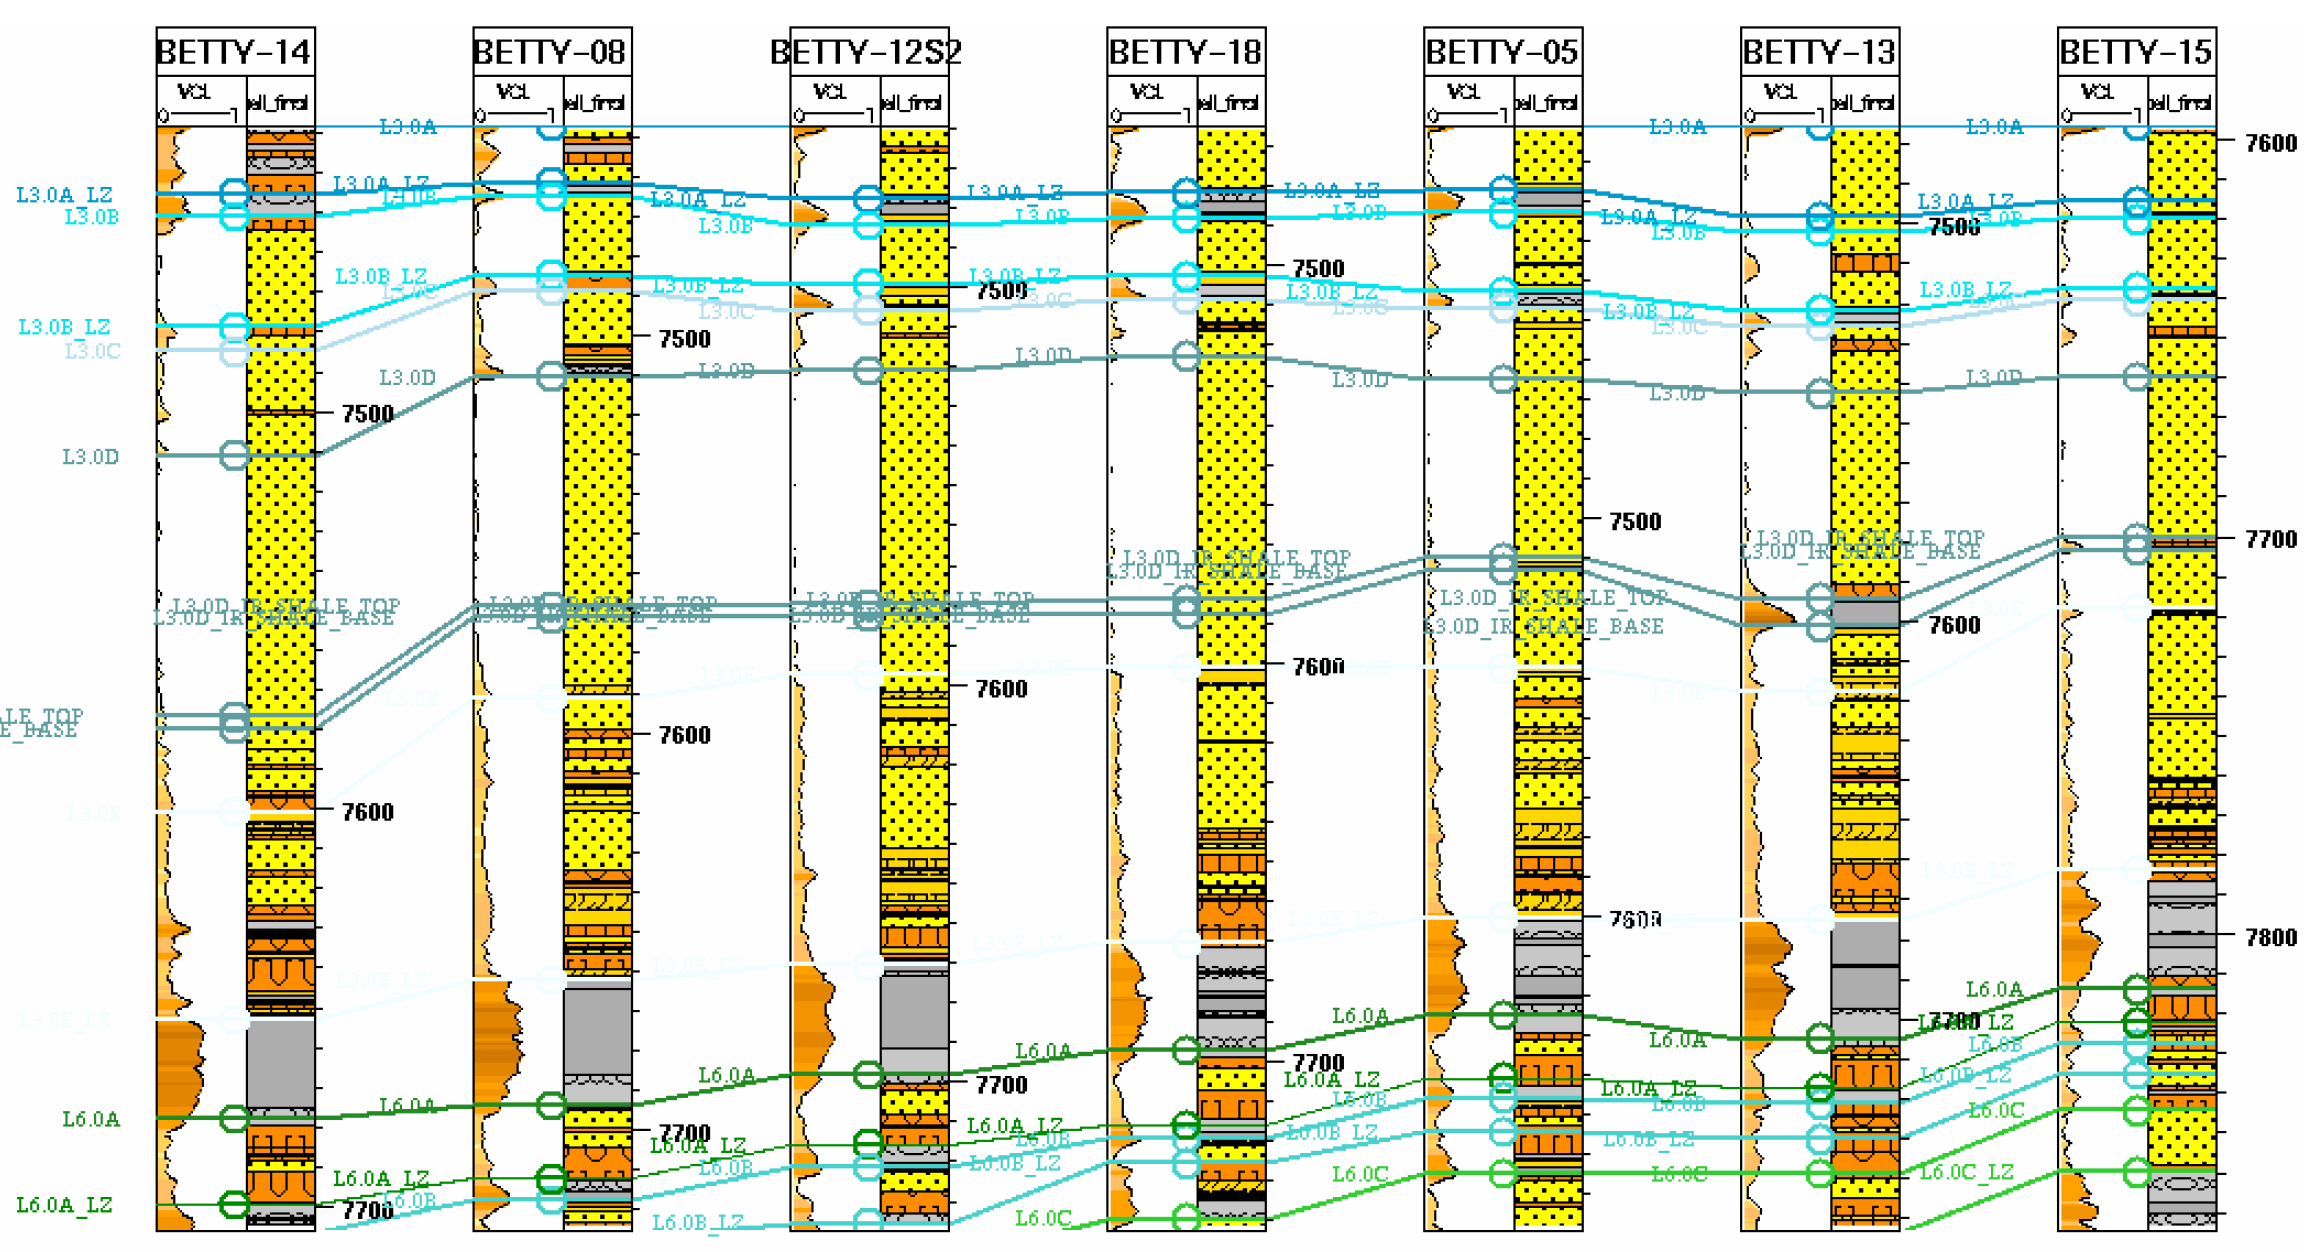
Figure 8. A cross-section panel from the SSW (left) to ENE (right) going through the depositional strike of L3 reservoirs in Betty field showing lateral continuity of most of the best reservoir quality sandstone (in yellow) and inner-neritic shales (in gray). Vertical heterogeneity is also a function of the distribution of poor quality sands (in orange). The tracks for each of the wellbores shows the volume clay and the lithofacies distribution as estimated from RockCell neural network technique in the left and the right, respectively.