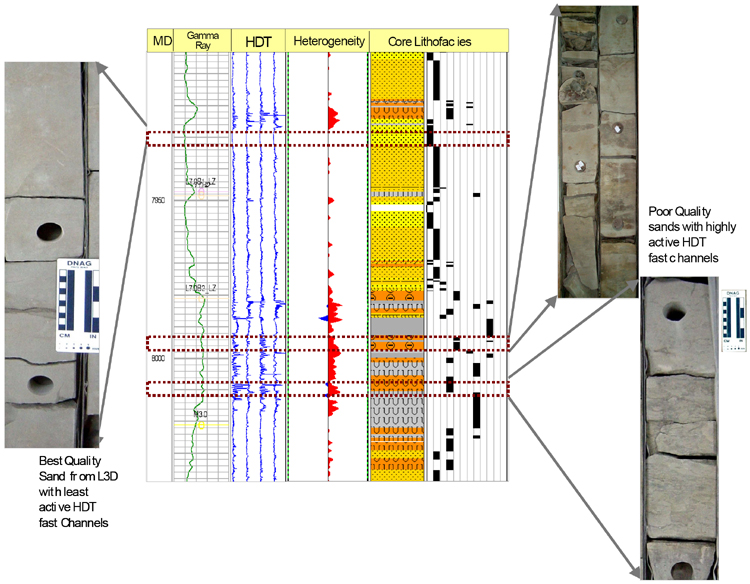
Figure 4. Rock Fabric Analysis via BorTex using the dipmeter logs showing least active microresistive curves for massive, poorly stratified sandstone (left) in Betty-5. Highly active curves are observed in clay-clast bearing storm-dominated-event beds (top-right) and intensely bioturbated sandstones, both of which show high conductive heterogeneity as calculated from the analysis (red shading on the heterogeneity track). This analysis captured the fine scale depositional heterogeneity as conductive and resistive anomalies.