Click on image to view enlargement.
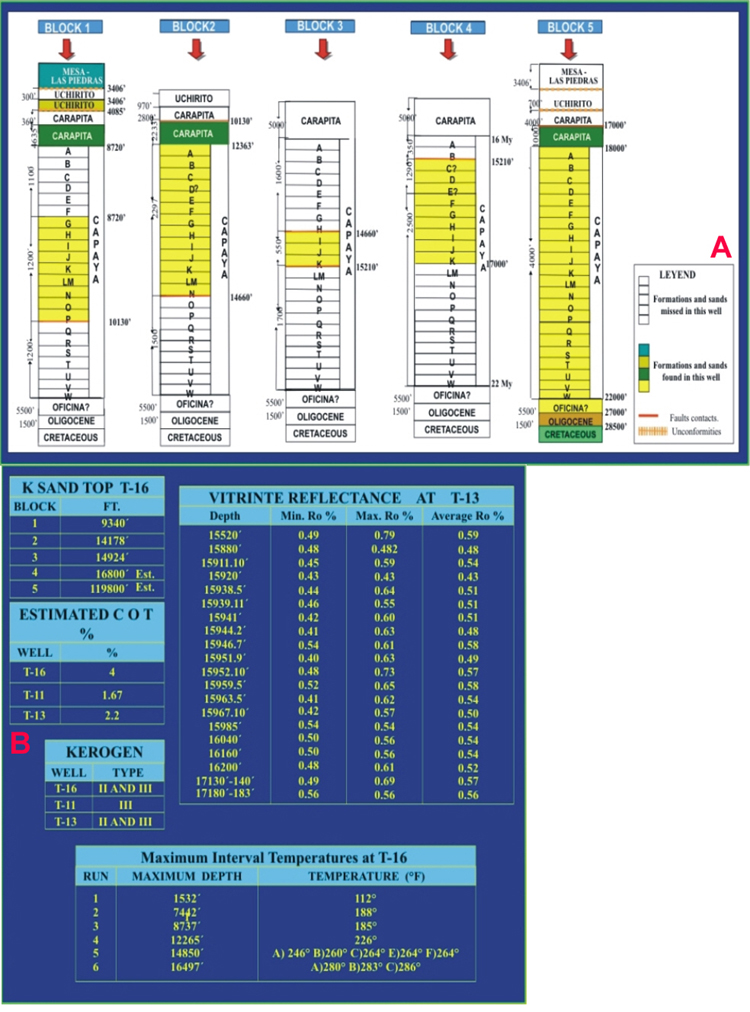
Figure 3.2. A. Diagrammatic representation of the distribution of formations and sands in fault blocks in the study area. B. Summary of geochemical data from TAG-16, TAG-13, and TAG-11 (estimated total organic carbon, vitrinite reflectance, kerogen type, and maximum temperature).