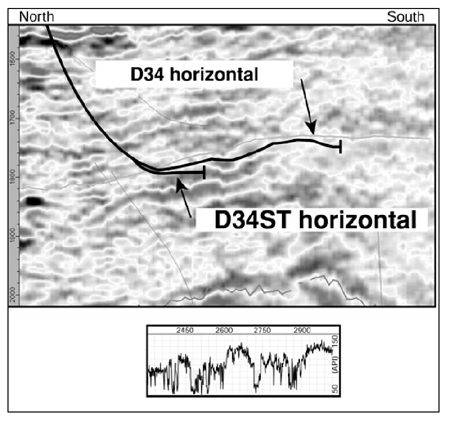
Figure 25. L10 sandstone as portrayed by gamma-ray curve (bottom) in the D34 lateral section (top), South Pass 62 field. Wet zones within the overall pay sandstone indicated more stratigraphic complexity than expected.
Figure 25. L10 sandstone as portrayed by gamma-ray curve (bottom) in the D34 lateral section (top), South Pass 62 field. Wet zones within the overall pay sandstone indicated more stratigraphic complexity than expected.