Click on image to view enlargement.
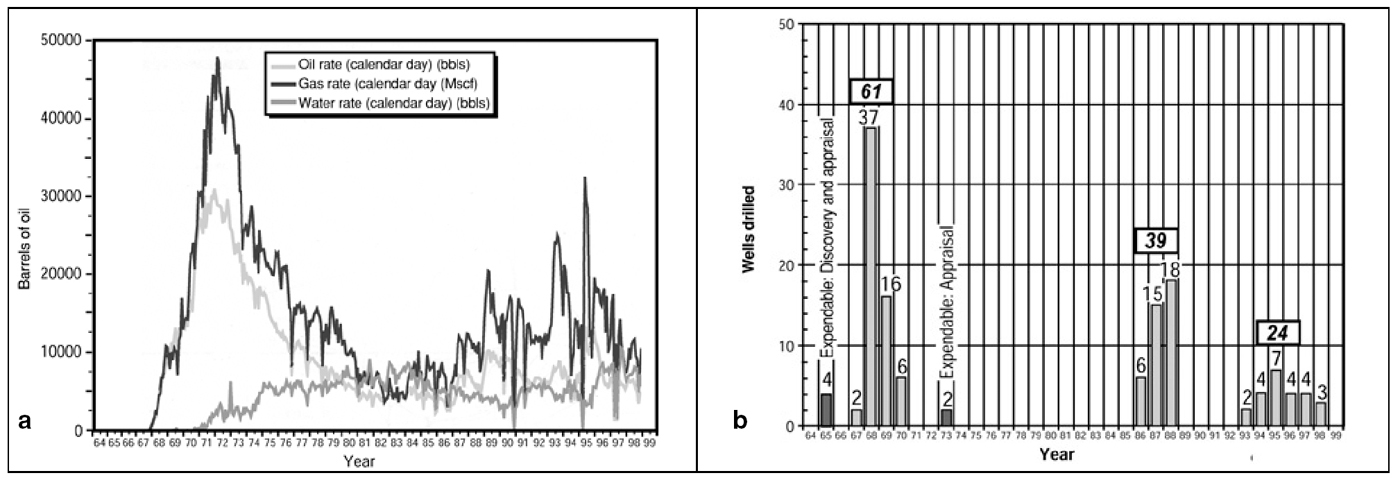
Figure 2. (a) Daily production of oil, gas, and water in the South Pass 62 field, plotted by year. Production decreased from peak rates in 1971 to a low of 2000 BOPD in 1994. (b) Well activity by year in the South Pass 62 field. Dark gray bars indicate exploratory and appraisal wells. Light gray bars indicate development and redevelopment wells. Primary field development occurred between 1967 and 1970, redevelopment in the mid-1980s, and the horizontal-drilling program in the mid-1990s.