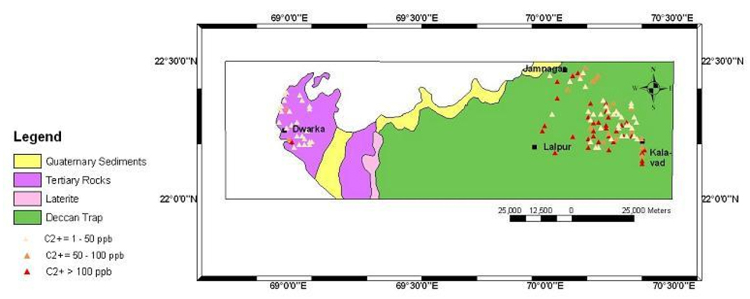
Figure 3. Concentration of ΣC2+ in soil samples plotted on the geological map of Dwarka and part of Jamnagar sub-basins, Saurashtra. The concentrations are depicted in three different colors by triangles.
Figure 3. Concentration of ΣC2+ in soil samples plotted on the geological map of Dwarka and part of Jamnagar sub-basins, Saurashtra. The concentrations are depicted in three different colors by triangles.