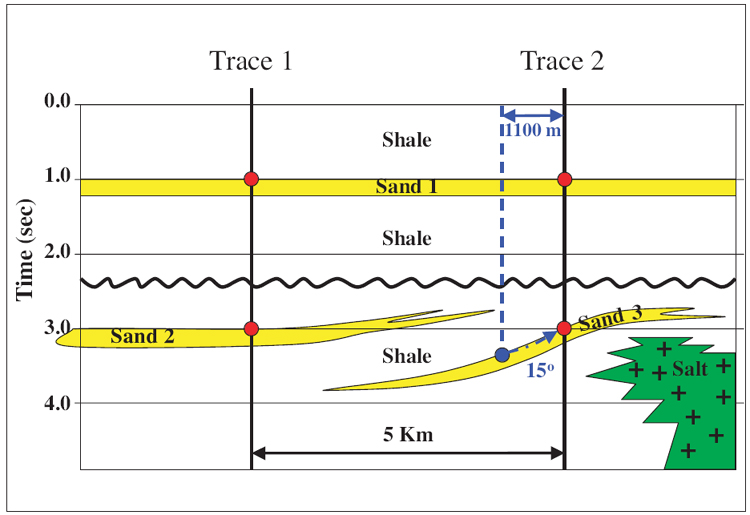
Figure 3. Illustrative earth model. Reflection coefficients for sands are identical. Red dots are where the amplitudes have been calculated in Figure 4. Blue dot is position of amplitude for dipping Sand 3 before seismic migration moved amplitude 1100 m laterally and 275 m (200 ms) vertically updip (Vavg-2860 m/s).