Click on image for enlargement.
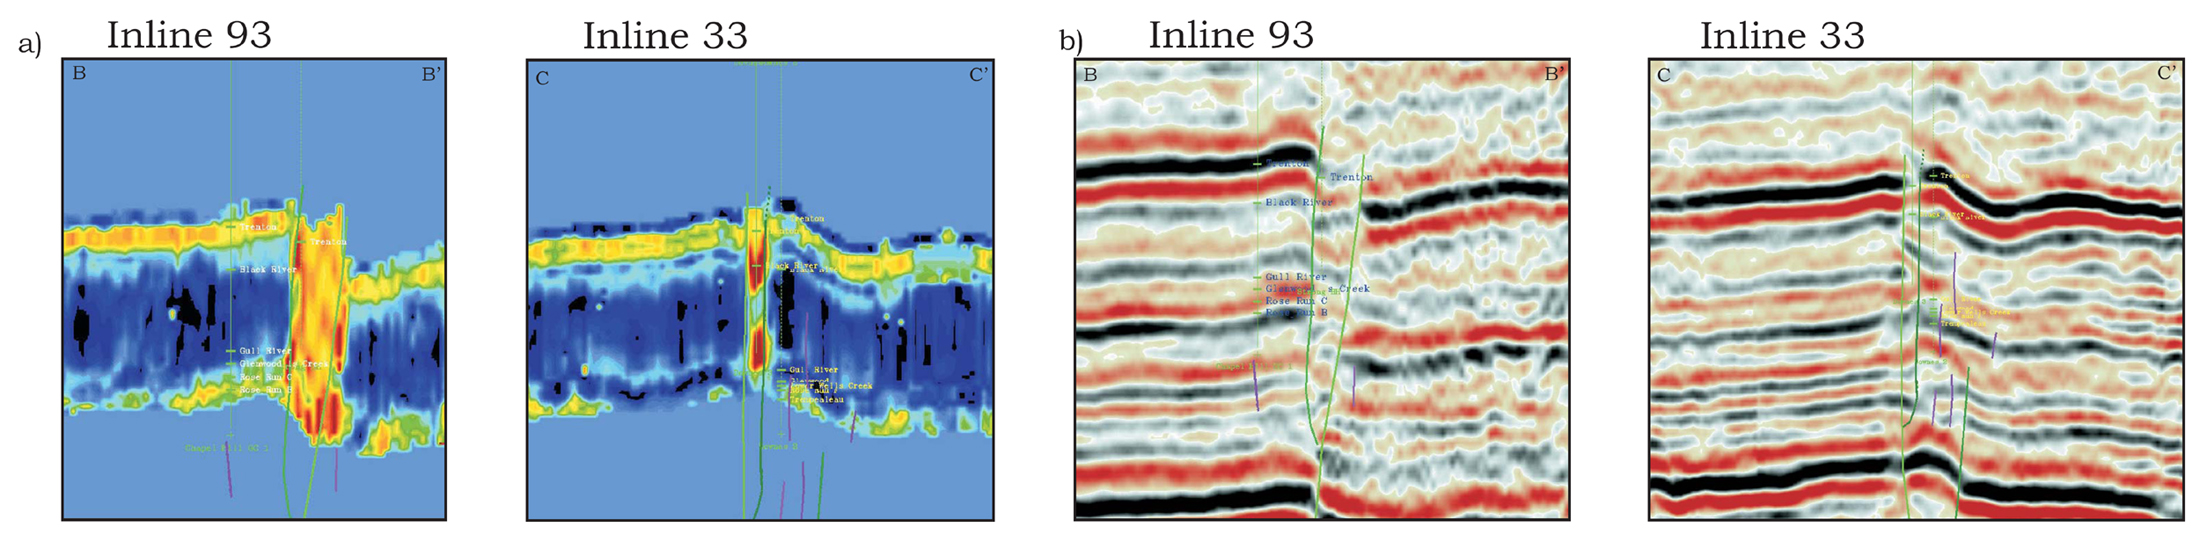
Figure 17. a). Transects through the porosity volume; high porosity is shown in dark reds, while low porosity is in dark blue and black. The volume was only generated for the interval from the top of the Trenton to the Trempealeau horizon. Inline 93 through the porosity volume with Strong UN #1 shown and Inline 33 with the productive Downes #3 on the left and the non-productive Downes #2 on the right. The porosity development is greatest in the areas between the limbs of the flower structures. b). For comparison, the same inlines are shown in the reflection seismic volume.