Click image for enlargement.
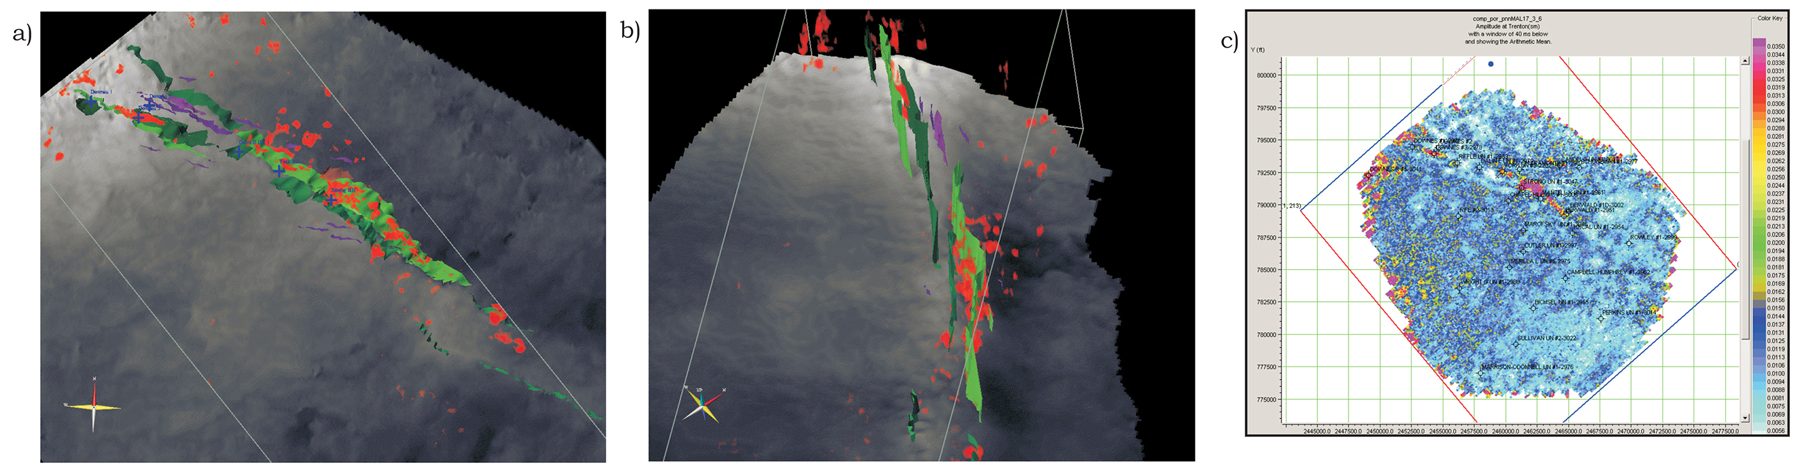
Figure 16. a),b). By exporting the created porosity volume into a program that allowed the faults and seismic to be viewed together in 3-D, it was possible better to visualize the relationship between the faults and the predicted porosity. Values below about 5% porosity were made transparent so that the high-porosity (producing) areas could be highlighted. While some noise was predicted by the analysis, c) especially on the edges of the survey, in general the porosity is closely associated with the mapped fault network. The highest porosity values are also concentrated in the areas of intense faulting, especially where the flower structures are located. It was also apparent that although the main fault trend continues at about 122o –302 o, the porosity development did not continue with the trend. Instead the porosity is better developed along the NW left-lateral step-over fault (Figure 7) that trends 105 o -285 o, where there is also a small flower structure.