Click image for enlargement.
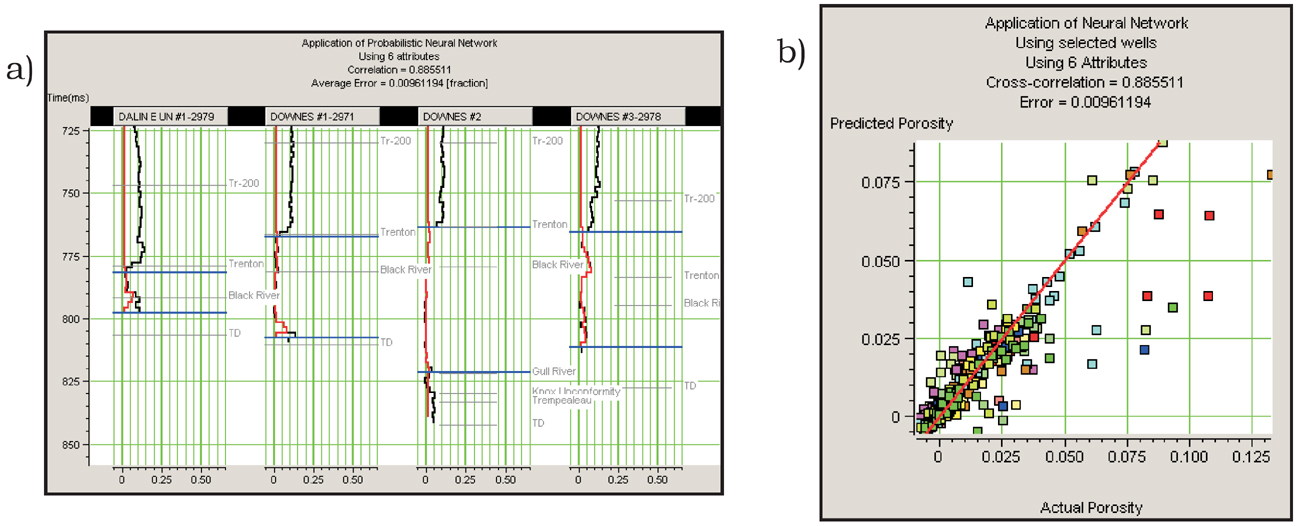
Figure 15. a). The application of the neural network to the training data; the average error was 0.96% and the correlation was 89%. The prediction closely matches the target log (PHIA), except at the bottom of some of the wells where it under-predicted the values. b). Crossplot of the predicted versus the actual values of porosity. The high number of data points is indicative of a volume-based approach, which gives more statistically significant results (Hampson et al., 2001).