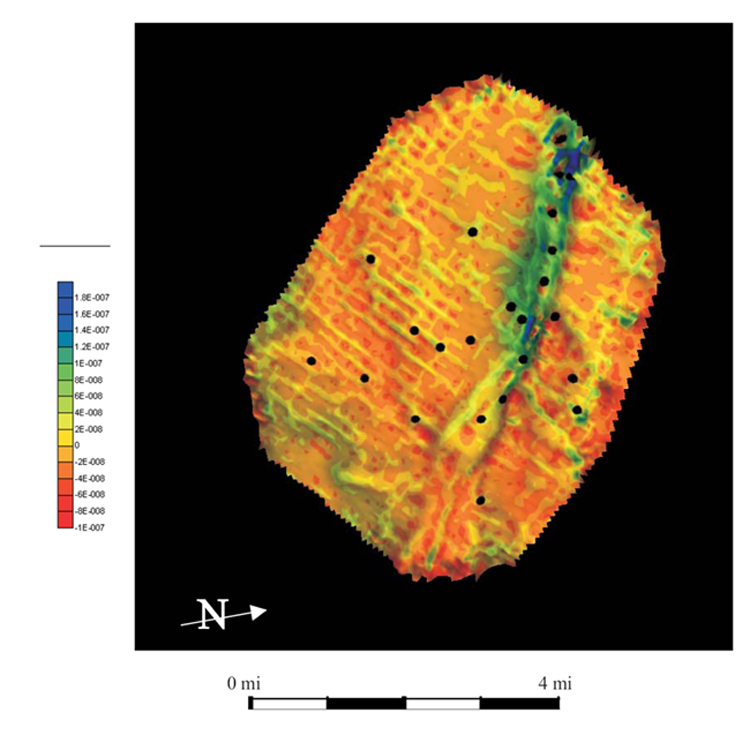
Figure 11. Maximum curvature extracted from the prestack Trenton horizon, draped over the 3D surface. Negative curvature is seen in red and orange, while positive curvature is in blue and green. The main fault ridge is clearly a positive anomaly (convex-up), while well locations (black dots) are located in small negative curvature anomalies (concave-up) along the ridge.