Click image for enlargement.
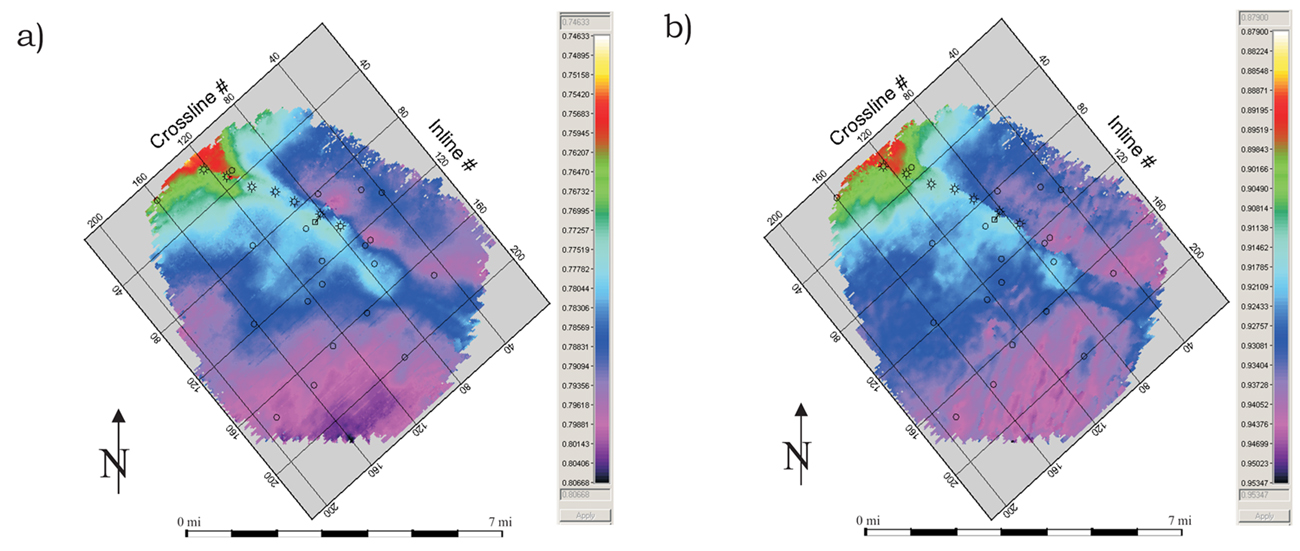
Figure 5. Time structure maps for top of the Trenton (a) and Top of the Basement (b). Both structure maps show a ridge associated with the faulting and productive trend. The Top Basement map shows some NE-SW-trending structures that appear to be small grabens in cross section (see Figure 4). However, these structures are not apparent at the Trenton level.